
I often find myself in situations that require quick action and a strong commitment to system analysis.
When there is a sudden spike in system temporary storage growth—often caused by an abnormal increase in temporary storage consumption—it becomes difficult to pinpoint which jobs are actually responsible for the increased resource consumption.
Before reaching critical situations, it can therefore be very useful to promptly identify the jobs that are consuming the most temporary storage.
In this case, the SQL services provided by IBM come to our aid. Using the ACTIVE_JOB_INFO table function, it is possible to obtain detailed information about active jobs and analyze their temporary storage consumption.
Basic Usage Example
SELECT JOB_NAME,
       SUBSYSTEM,
       TEMPORARY_STORAGE
FROM TABLE(QSYS2.ACTIVE_JOB_INFO()) X
ORDER BY TEMPORARY_STORAGE DESC
FETCH FIRST 10 ROWS ONLY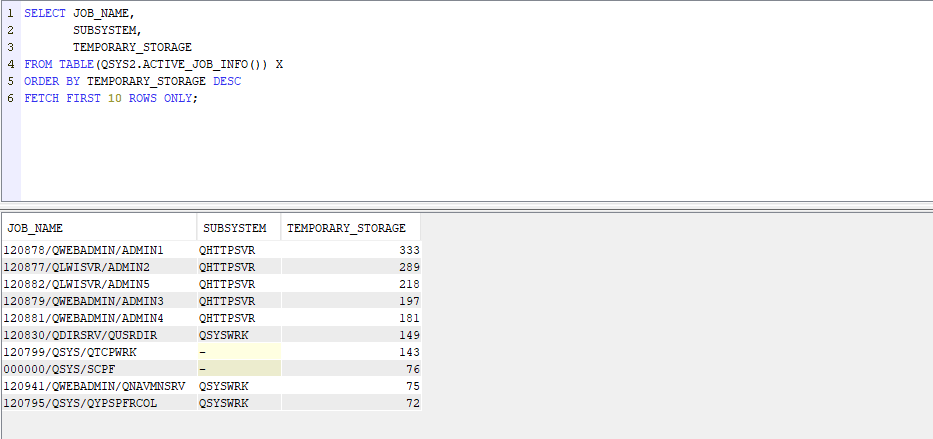
This table function—like many others provided by IBM—allows you to simplify and automate numerous tasks that would otherwise have to be performed manually.
In this specific case, the query returns the 10 jobs that are using the most temporary storage, sorted in descending order. This makes it possible to quickly identify the main cause of the increase in temporary storage usage and take action before the situation becomes critical.
This can, of course, be implemented to support other types of monitoring (such as SYSBAS disk space monitoring) and QCMDEXC to immediately HOLD the jobs causing the temporary storage increase (although this could be particularly dangerous).
Deep Dive: When the Culprit is Known
But what if the “culprit” is already known?
In this case, you can retrieve additional information to understand why the situation occurred, so as to prevent it from happening again in the future.
From the same family of SQL services, you can retrieve the SQL statement currently being executed:
SELECT JOB_NAME,
       SQL_STATEMENT_TEXT
FROM TABLE(
    QSYS2.ACTIVE_JOB_INFO(
        DETAILED_INFO => 'ALL',
        SUBSYSTEM_LIST_FILTER => 'SBS',
        CURRENT_USER_LIST_FILTER => 'USER'
    )
) WHERE JOB_NAME LIKE '%NAME%';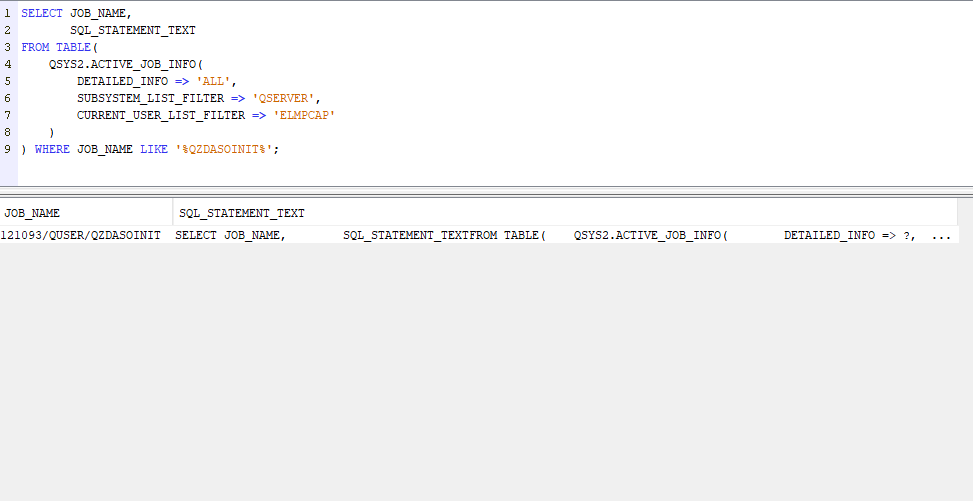
This allows you to identify the SQL query that the job has currently running—or possibly waiting—and can provide very useful information for debugging the issue.
Beyond This Use Case
Of course, this is just one of the many possible uses of SQL in an IBM i environment. The SQL services provided by IBM offer extremely powerful tools for performing a wide variety of tasks, such as remotely executing commands directly via SQL.
But that could be a topic for a future discussion.
What do you think about this topic? Let me know!
In the meantime, the official IBM documentation on SQL services is available here, complete with examples and use cases:
Have a great day, everyone!
Davide