Many, many times I read in reports from customers or in conversations made in the thousand calls on Teams still misunderstandings about the use of certificates on IBM i systems.
Let’s try today to provide clarity once and for all.
Speaking of certificates in the field of information security, we must distinguish different types of certificates. The first type is certificates with private keys; generally these certificates are used in authentication both from the server’s point of view but also for the client (as in the case of SSH keys). In fact, they are enablers for the use of secure protocols, such as FTPS, HTTPS, TELNETS, etc.
Using secure services, however, it is critical to be sure you are talking to the right peer, otherwise one of the building blocks of cybersecurity. Hence, the need arises to define specific entities that are responsible for signing certificates, whether they are clients or servers. These entities are called Certificate Authorities. However, we can say that CAs are themselves also certificate that enable systems to communicate securely with other systems by asserting ownership of their child certificates.
Each operating system has its own certificate repository, my Mac for example has the key fob, IBM i systems also have their own, the DCM (digital certificate manager).
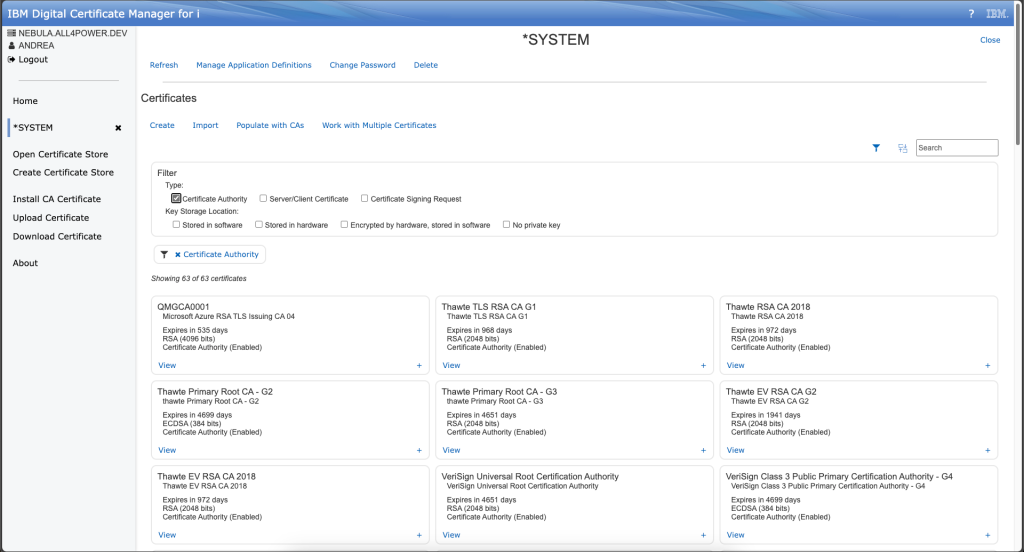
The DCM’s gui is available at http://yourip:2006/dcm. By default, every certificate is stored in *SYSTEM archive but you can also define a custom one.
As you can see, even the DCM treat CA and client/server certificate in different way because of their different nature. From this portal you are able to import/export certificate using easy download and upload feature. In this way you are able to use a temporary path for uploading certificate directly from your browser without transferring it to your system before. In addition, you can also use DCM to create a certificate sign request (CSR), in this case the form asks you to set some values such as name, ip and not forget to put subject alternative name, it’s quite important for HTTPS services, and honestly I don’t know why they do not put it as mandatory.
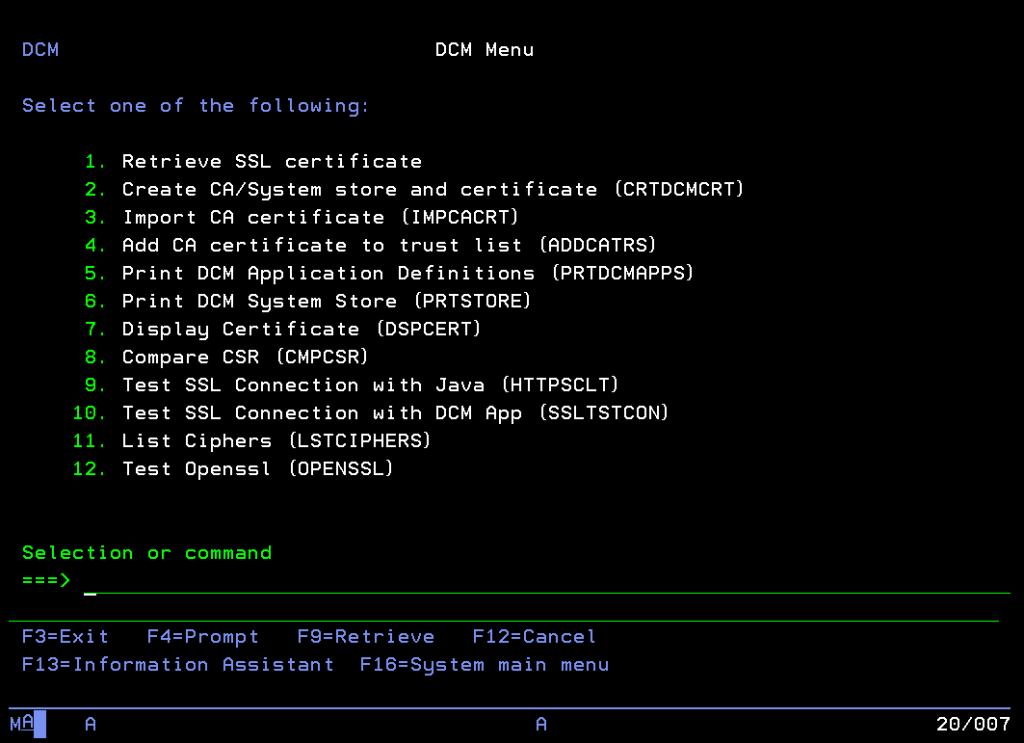
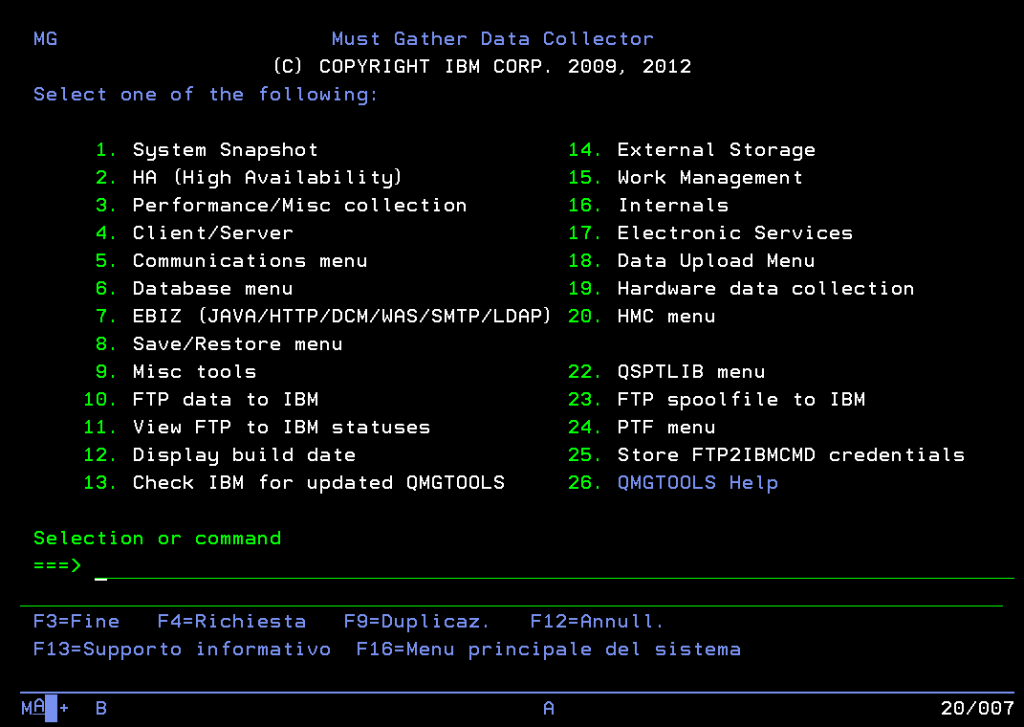
Sometimes could be very helpful import easily some AC… maybe you need to use HTTP functions in QSYS2 and you need to validate server CA. With QMGTOOLS is quite easy. From MENU use option 7 (EBIZ) and after that option 1 DCM/SSL.
Here you have a rich list of feature, for instance you can retrieve or import a certificate, you can check a certificate or you can test some application using OPENSSL. In our case we will try to retrieve and import a certificate into our CA store.
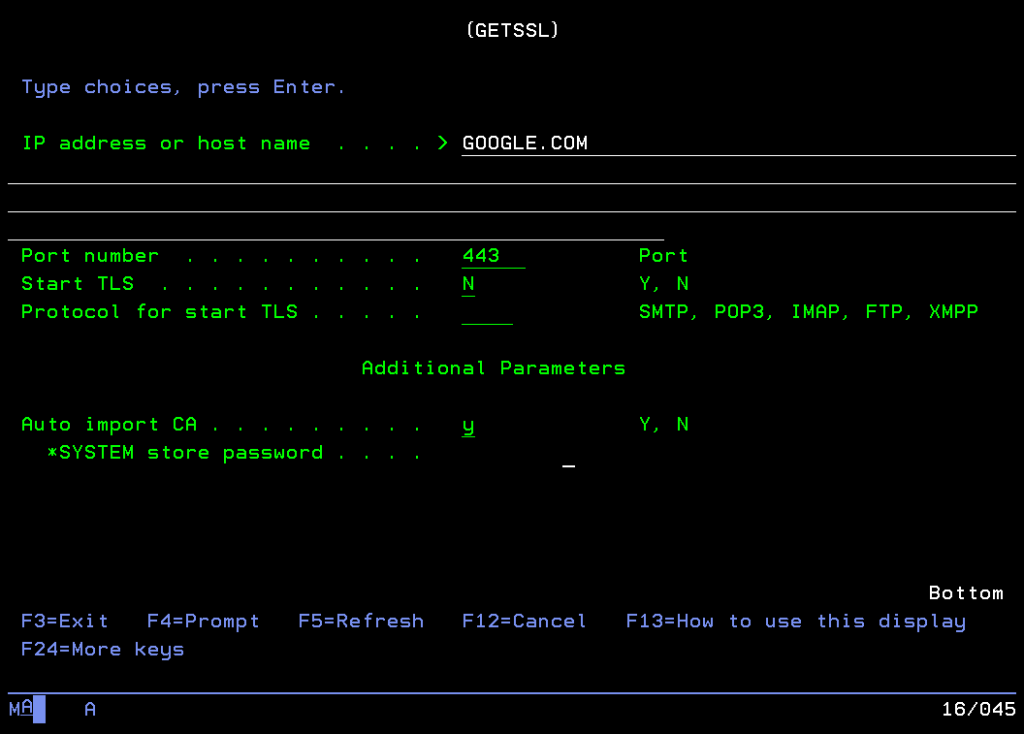
In our case, we are trying to import the CA that has issued certificate for google.com (service listening on 443 port). Consider that it works only if all certificate path before this CA is already trusted, in some cases on DCM you can find a useful list of CA that you could enable. This list is automatically updated with ptfs.
And you, have you ever used DCM or GETSSL command in your environment?
In the last post, we have seen how to manage defective PTFs automatically using SQL.Today, we will see how it’s easy to check current PTFs level directly from IBM servers.
Let me say that is quite important to keep systems update, both in terms of version and PTFs. In this way you are able to use all the new features, SQL services and last, but not least, is obtaining all the security-related patches that are needed to cover all the vulnerabilities that come out from day to day.
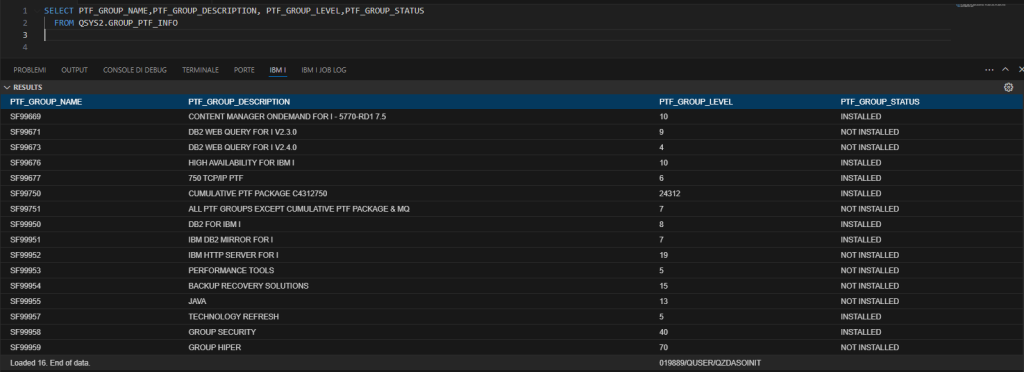
Let’s check our current PTFs group using GROUP_PTF_INFO view:
SELECT PTF_GROUP_NAME,PTF_GROUP_DESCRIPTION, PTF_GROUP_LEVEL,PTF_GROUP_STATUS
FROM QSYS2.GROUP_PTF_INFO
So, in my example I’ve got some groups in NOT INSTALLED status, it means that the system knows that there are several PTFs that are not installed… In my case is OK, that because I’ve ordered some PTFs using SNDPTFORD.
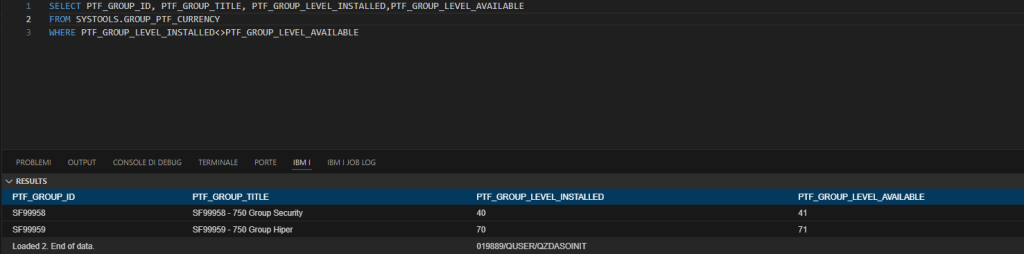
Now, let’s compare my levels and IBM official levels using GROUP_PTF_CURRENCY, listing only groups that have a difference between current are remote level:
SELECT PTF_GROUP_ID, PTF_GROUP_TITLE, PTF_GROUP_LEVEL_INSTALLED,PTF_GROUP_LEVEL_AVAILABLE
FROM SYSTOOLS.GROUP_PTF_CURRENCY
WHERE PTF_GROUP_LEVEL_INSTALLED<>PTF_GROUP_LEVEL_AVAILABLE
It’s quite fun, on my system I’m quite updated I need only to install SECURITY and HIPER groups. Let’s consider that these groups are the ones that are updated most frequently.
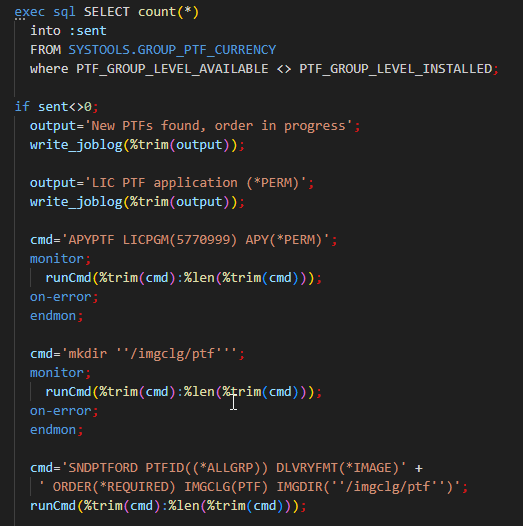
Now that we have understood all SQL services that we need to use, we will start creating a simple program that will check PTF currency and if there are some new PTFs we will proceed downloading them.
Here is the code to do that: firstly, we will count how many groups on my system are not current. If I found any, I will proceed applying permanently all LIC’s PTFs, that is quite useful when you install cumulative group. After that we will create an IFS path in which we will receive all the ISOs. At the end, we will order all groups PTFs creating an image catalog.
So, this is an idea, you can also choose to order only single groups or you can also choose to download only save files instead of bin-format images.
In this way you can automatically check and download updates for your system. Even in this case you need an internet connection, without this connection you are not able to query IBM servers. Another thing to consider is that before running this program in batch you need to add all contact information (CHGCNTINF command).
Even in this case, this source is available on my GitHub repo.
Several days ago, I opened a ticket to the IBM support for a problem that was affecting one of my production lpar. The technician ask me to generate a System Snapshot and once uploaded to website an automatic agent warned me about a defective PTF that was installed on my partition. I’ve also read the cover letter and wow, this PTF could make my savsys not good for a restore.
We are IBM i systems engineers, we must not panic, so let’s sling on our SQL buddy and figure out how to ferret out faulty PTFs installed on our systems.
The first way is to use QMGTOOLS utility that you can install following this page:
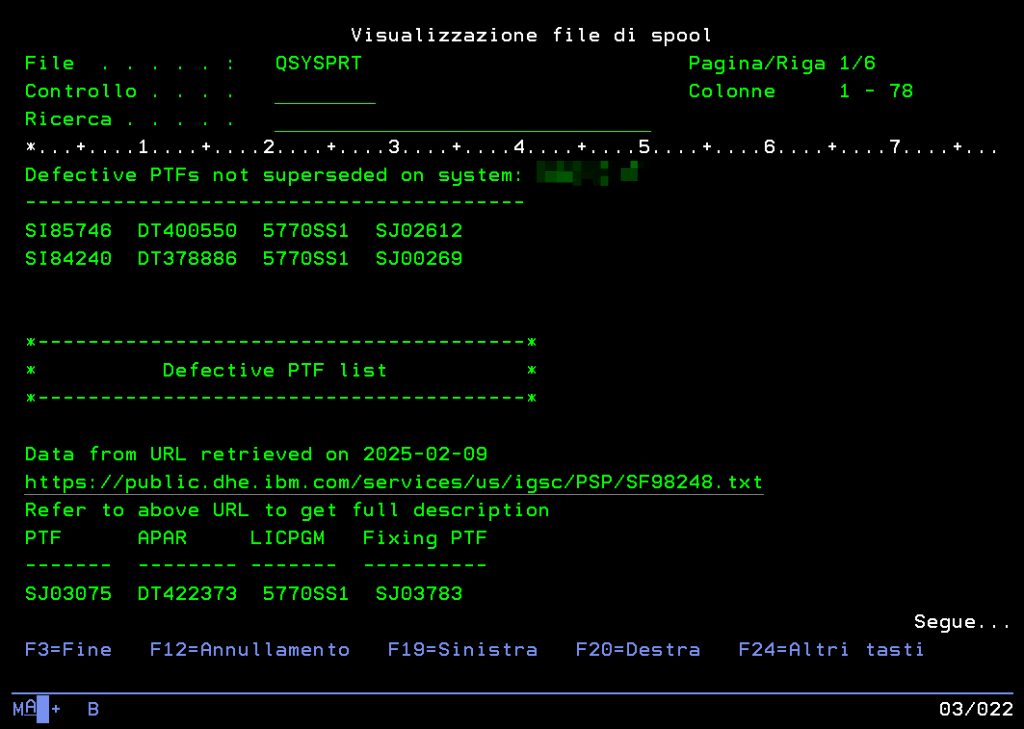
So from MG menu you can user option 24 (PTF MENU) and after that option 3 (COMPARE DEFECTIVE PTFS FROM IBM). Now, your IBM i system connects to IBM servers and check the list of installed PTFs with official list of defective PTFs.
This is one of the possible way to do that, but honestly is not my preferred one, that because it requires some manually actions, for instance you need at least to watch the spool file.
And here we are to my personally preferred method, using the DEFECTIVE_PTF_CURRENCY view in SYSTOOLS. This view is quite helpful because gives you all information you need when you talk about defective PTFs as ID of defective PTF, licensed product program and fixing PTF, now let’s test this query on my system:
select DEFECTIVE_PTF,PRODUCT_ID,APAR_ID, case when FIXING_PTF is null or FIXING_PTF='UNKNOWN' then '' else FIXING_PTF end as FIXING_PTF
from systools.DEFECTIVE_PTF_CURRENCY
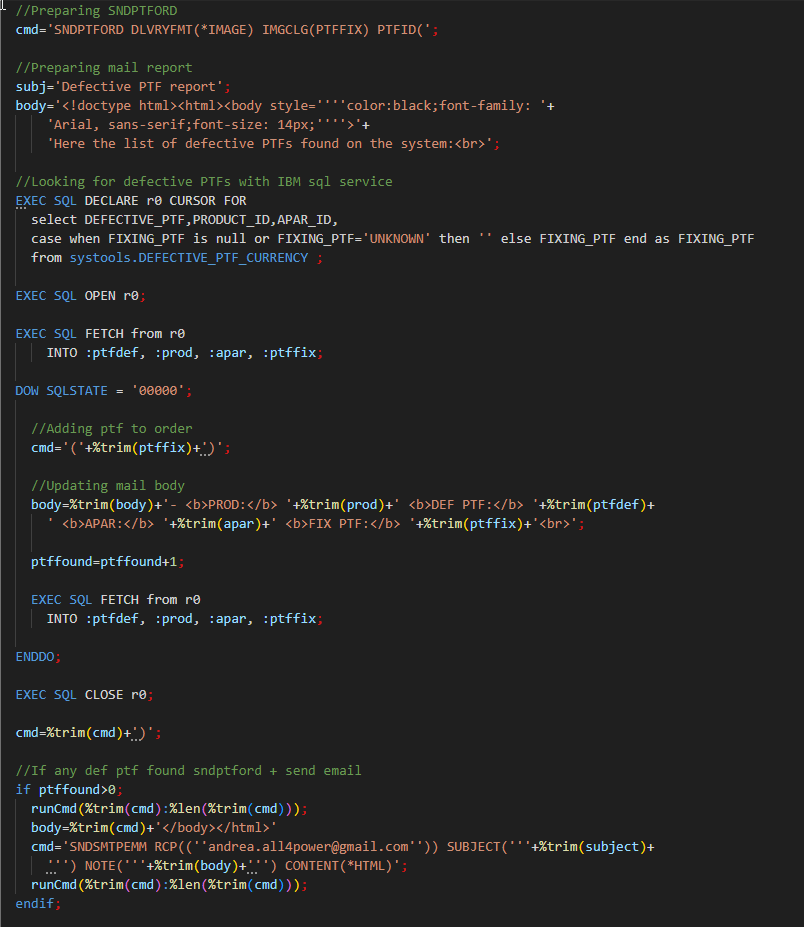
As you can see in my example, I have no rows, so it means that I haven’t got any defective PTF. If you look at my query I have tested the value of FIXING_PTF column, that because now we will create an easy RPG program that automatically check defective PTFs, list all fixing PTFs, order them and after that an email with report will be sent.
As you can see, if any defective PTF was found, the system will order the fixing PTF and will email me with the entire list of defective PTF.
You can find this code on my git repo. Consider that you need your partition is able to reach IBM servers for getting defective PTFs list and to order fixing PTFs.
And you, how do you manage defective PTFs on your system?
In the last post, I’ve presented a simple way to monitor some particular metrics of your IBM i.
In addition to system monitors, you can go for message and queue monitoring. It is often the case that some information about the status of some system services as well as application services is poured into some message queue (typically the QSYSOPR), hence the need to have an effective probe to take in those messages.
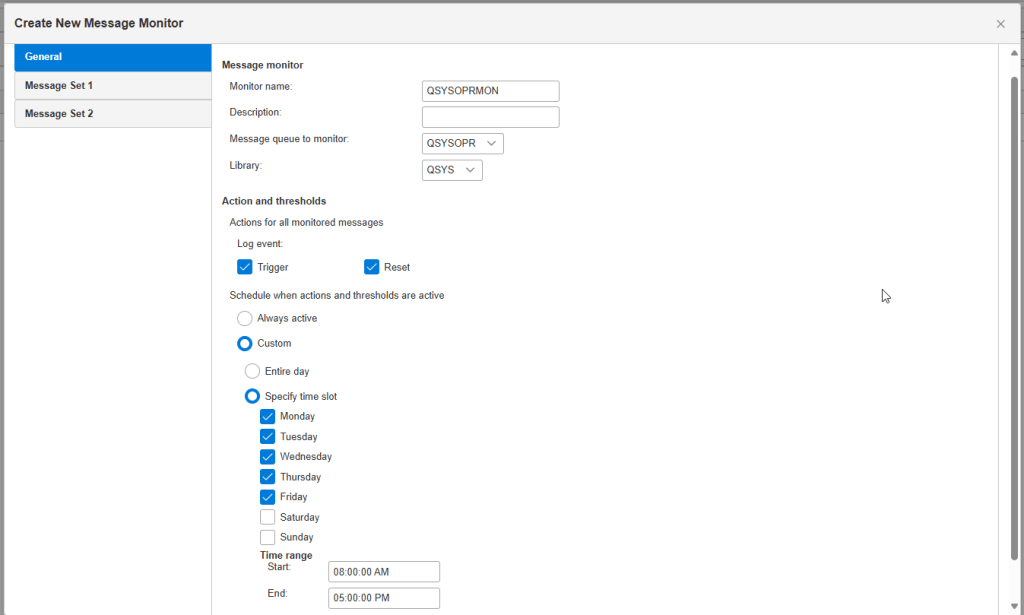
For this reason, again through the Navigator for I GUI, it is possible to go and define the monitoring of certain messages and in some cases even the responses that the system gives on its own. Once connected to Navigator, please click MONITORS and choose MESSAGE MONITORS. Now click on CREATE NEW MESSAGE MONITOR and compile form as you prefer. In my example, I’m going to configure a QSYSOPR monitor that works only in office time.
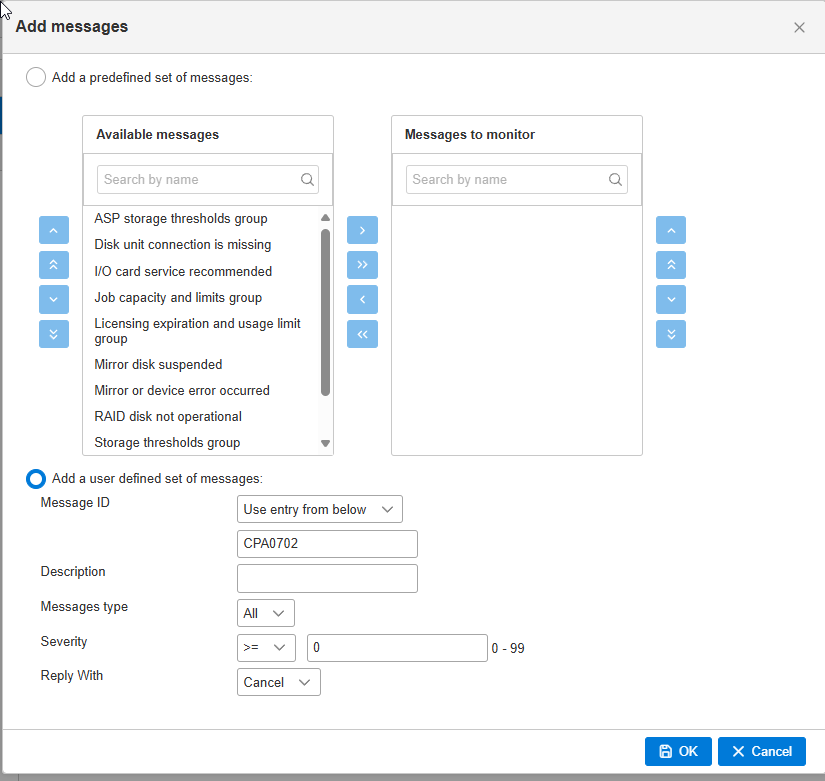
Now, clicking on Message Set you are able to define trigger and relative actions, to do that you need to specify a list of msgid that you want to monitor. You can start using pre-defined msgid lists shipped by IBM that cover some system topic. Even in this page, you can define some automatic replies that system can give to MSGW jobs:
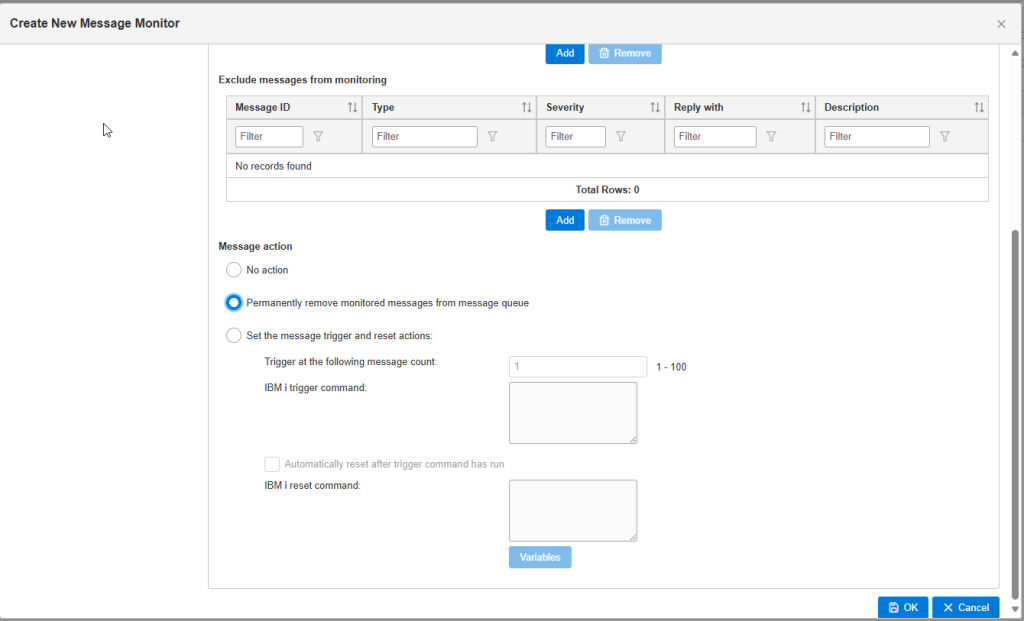
The last thing, but not the least, is the capability to perform an action when a message as been sent on the message queue, for instance you can remove that message from the queue or you can perform some OS command (like sending email ecc):
I think that for this topic is everything, please give me your feedback about monitoring world and your experience about that.
One of the most important allies of a sysadmin is a good monitoring system.
In this first tutorial, I will show you how it’s so easy implementing an IBM i system monitor using features that are already included in the OS without using third part software.
To do that, we are going to use IBM Navigator for i, so once connected please click on the icon below and choose SYSTEM MONITORS:
At this point, you are able to see active monitors (if you there are any) or you can proceed configuring one new. Let’s consider that nowadays there is quite a little set of metrics that you can use for your own monitoring tool. Some days ago I created a new idea to ask IBM to give the opportunity to create your own metrics by using SQL, here you can find the link to my idea, if you find it interesting please vote that.
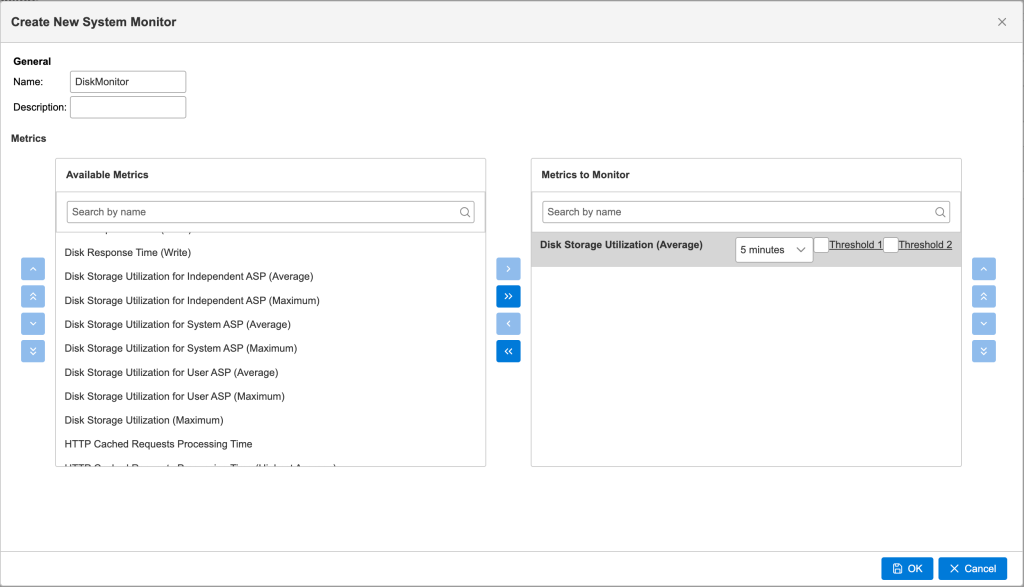
So let’s start with a simple monitoring example; so I want to create a monitor that must control my disk space utilization… So, from the drop-down list, choose CREATE NEW SYSTEM MONITOR. Once clicked, choose Disk Storage Utilization (average) from the metric list and after that you have to choose the frequency of the check, in my example I’ve chosen 5 minutes.
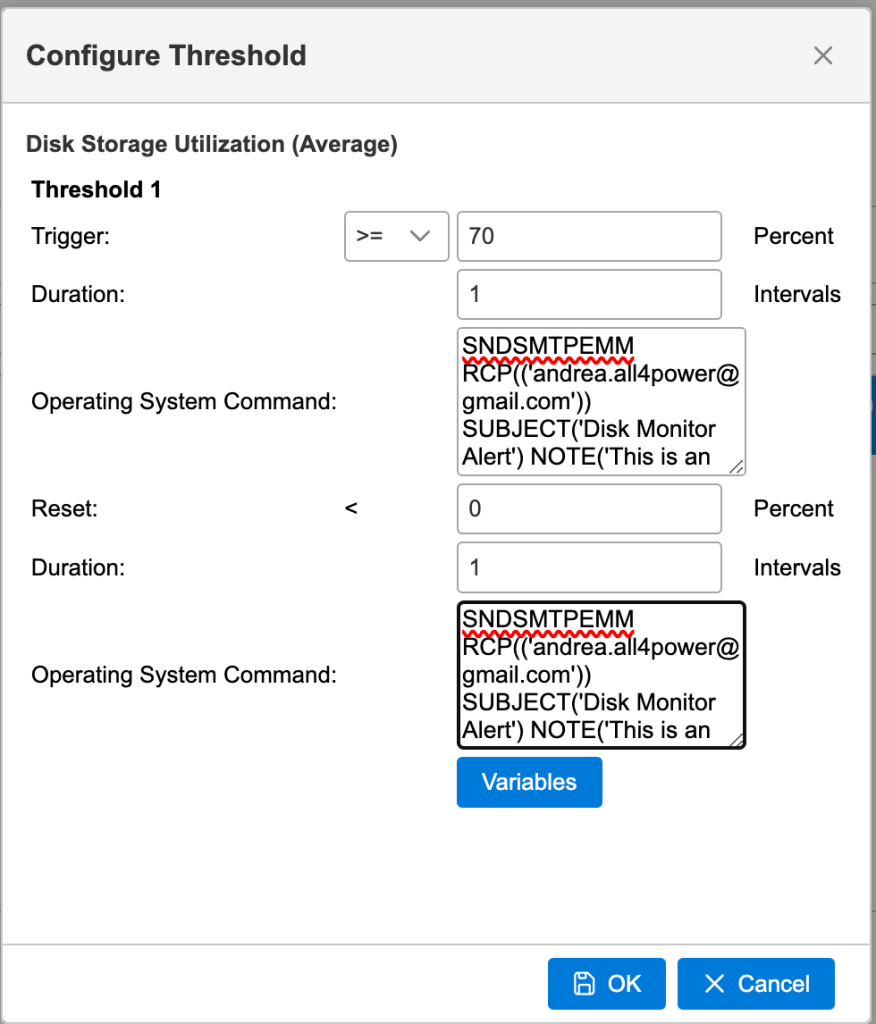
Now that we have chosen what kind of metric I want to use and the frequency of the check, we only need to set of thresholds, and we have to define what happens when the threshold has been reached using OS commands.
In my case, I will define one threshold that is triggered when disk is used more than 70% for more than two intervals. When the condition is verified, monitor will email me:
As you probably understand, you can define a combination of metrics monitored in the same “check”.
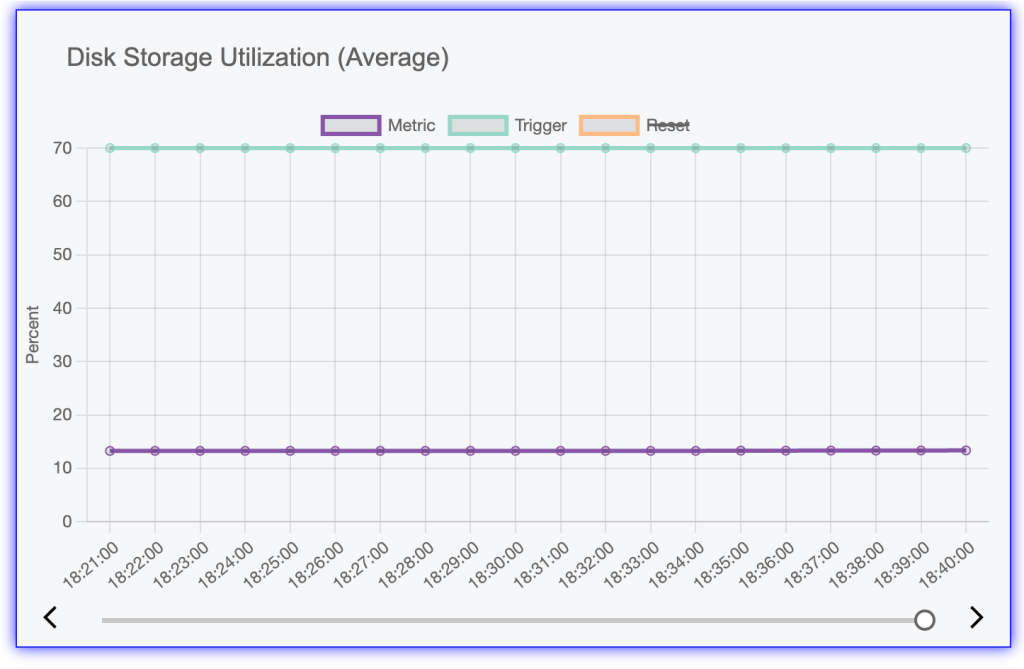
Consider that once you enable your monitoring, automatically the system starts probing the system status according to what you set. This data is stored and can be analysed by graph; this is a very convenient feature if you want to check the data over the long term to determine, for example, whether there are any growth trends. It is also possible to check monitoring log, you can also see when some threshold as been reached.
Here you can find an example of monitoring graph:
I will put another post on this blog about message monitoring.
One of the dream of sysadmins is monitoring system SQL usage, to check how much temporary storage is used by SQL statements, to check long-running SQL statements and so on. Daily, in my job I am able to see a lot of situations in which user run a lot of SQL statements with ODBC tools in Excel and without them noticing, the temporary memory began to grow because of all the correlations made.
But, what happens if I tell you that in IBM i this feature is already in OS?
Since IBM i V7R3M0 there is a nested mechanism that is called Query Supervisor and its goal is to define metrics on the execution of SQL statements such as the execution time, temporary storage, I/O and CPU count.
So, as I said before this feature is in the operative system so you needn’t to get some additional feature, the only thing you need is only to understand what do you want to do when a threshold has been reached. Yes, that because with this real-time monitor you are able to set up some different actions as:
holding job
ending SQL execution
sending message to a message queue
logging SQL statement
…
At this point, we can start with some considerations about this topic:
as mentioned earlier, this is real-time monitoring so unlike other mechanisms or tools it calculates thresholds on live data, not based on estimates or assumptions.
metrics that can be monitored are CPU time (i.e., the amount of CPU seconds used during the execution of a SQL statement), elapsed time (i.e., the amount of seconds used to execute the SQL statement), temporary storage (i.e., the amount of temporary memory allocated expressed in MB), I/O count (i.e., the amount of I/O operations used to execute the SQL statement).
not all SQL statements trigger this mechanism, in fact some statements that do not require any kind of processing by the system (such as a trivial INSERT) are not considered. In addition, for some SQL statements the metrics computation is not based on the entire execution but only on the execution of some steps (for example, in a DELETE only the search for records to be deleted in the WHERE clause is part of the metrics computation, while the actual deletion of records is not counted). If an SQL statement contains references or calls to functions or procedures, in that case the metric takes into account the time taken to execute each individual function.
it is possible to go and define very precisely the thresholds and the mechanisms that trigger them; in fact, it is possible to go and work on individual subsystems, users, or jobs. By combining these filters, it is possible to manage individual situations in the optimal way.
Let’s add a new threshold on my dummy lpar!
So before starting, we are able to check if something was already registered with this query:
SELECT * FROM QUERY_SUPERVISOR
As you can see, I don’t have any row (no threshold has been setted up).
Now we will create a new threshold that monitor every 5 minutes all statements that are running for more than 30 minutes:
In order to check if everything is ok, let’s check the previous query, I expect to find two rows:
Please, pay attention to the DETECTION_FREQUENCY parameter, it indicates the distance between monitoring checks. It is necessary to identify a correct value that allows you to go and intercept critical conditions in the best possible way, here is a specific page about this parameter.
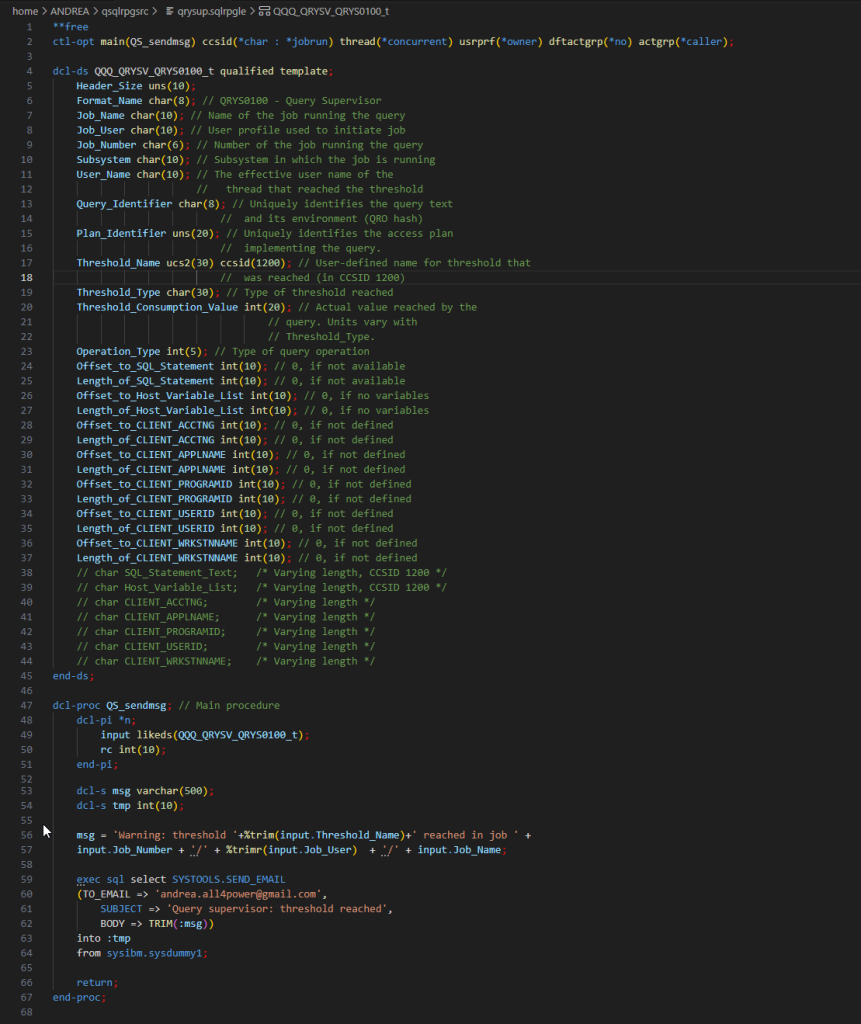
Now we have to build the program that will intercept and manage the attainment of the threshold. The IBM documentation presents some examples, I will also leave one below. It will simply e-mail me detailing the job that crossed the threshold:
To complete everything, we need only to register this program in exit point QIBM_QQQ_QRY_SUPER with this command: ADDEXITPGM EXITPNT(QIBM_QQQ_QRY_SUPER) FORMAT(QRYS0100) PGMNBR(1) PGM(UTILITIES/QRYSUP) TEXT('Query supervisor EXITPGM')