
A few articles ago, we talked about the native integration of the syslog format within IBM i. We also looked at two SQL services (the history log and the display journal) that were able to generate data in this format in a simple way.
Today, in this article, I propose a possible implementation of a SIEM, which, starting from the logs on the IBM i system, feeds a Grafana dashboard. For those unfamiliar with Grafana, this tool is one of the leaders in interactive data visualization and analysis. It has native connectors with a wide range of different data sources, and can natively perform alert functions on the metrics being monitored.
The downside is that there is no DB2 datasource (at least in the free version). In our scenario, we chose to rely on a PostgreSQL instance running on AIX, which allowed us to build the dashboard with extreme simplicity.
In fact, our infrastructure consists of one (or more) IBM i partitions that contain all the source data such as JRNRCV, history logs, etc., a small Python script that queries the systems using the two specific views, and the collected data is then sent to a PostgreSQL database, which is then queried by dashboards built on Grafana for analysis purposes.
Below you will find the Python code written:
- script information: this script can run directly on IBM i, but in fact, in an environment where there are several machines, it can be run from a centralized host. The only installation required is that of the ODBC driver, but there is a wealth of supporting documentation. In our case, there is a configuration file that contains both the database connection information and the host master data. The script can be invoked by passing LOG as a parameter (in which case the DSPLOG data will be analyzed) or JRN (in which case the QADUJRN entries will be looked at). Another parameter is the list of msgids of interest (valid in the case of LOG) or the type of entry (in the case of JRN), which is also supported as a value *ALL
- getQhst: this function extracts entries with the msgid specified as a parameter. In fact, the extraction checks the last entry in the dsplog and reads all entries from the last extraction to the last entry detected now
- getJrn: this function extracts entries from the system audio log. Again, the tool keeps track of the last entry read
As you can see, the extracted data is then dumped directly into a PostgreSQL table.
Below is the dashboard I built on Grafana:
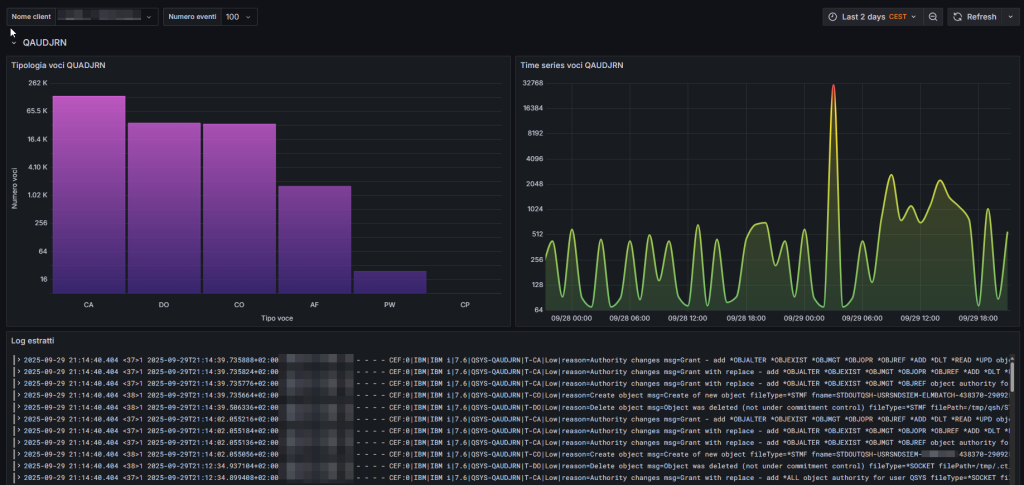
As you can see, there is fairly basic information, a graph showing the types of entries and their counts, a graph showing the occurrence of events on different days, and finally the extraction of events in syslog format. The same dashboard is also available for the history log.
Here is the code that I wrote:
Andrea
Thanks!!! i will a give a try