
A few days ago, a customer opened a case with me because he couldn’t understand the origin of the locks that were occurring on certain objects. In fact, this lock condition was causing problems for the application procedures, which clearly found the files busy and were unable to operate on them.
There are various solutions to this issue, but the one that seemed most convenient and functional to me was to use our friend SQL.
In the tool we will implement today, we will use the QSYS2.OBJECT_LOCK_INFO system view. This view returns a series of very useful information, such as the object being locked, the job that placed the lock, and the type of lock. However, it can also return very detailed information, such as the procedure/module and the statement.
Let’s look at an example of a query on this view without any filters: select * from QSYS2.OBJECT_LOCK_INFO
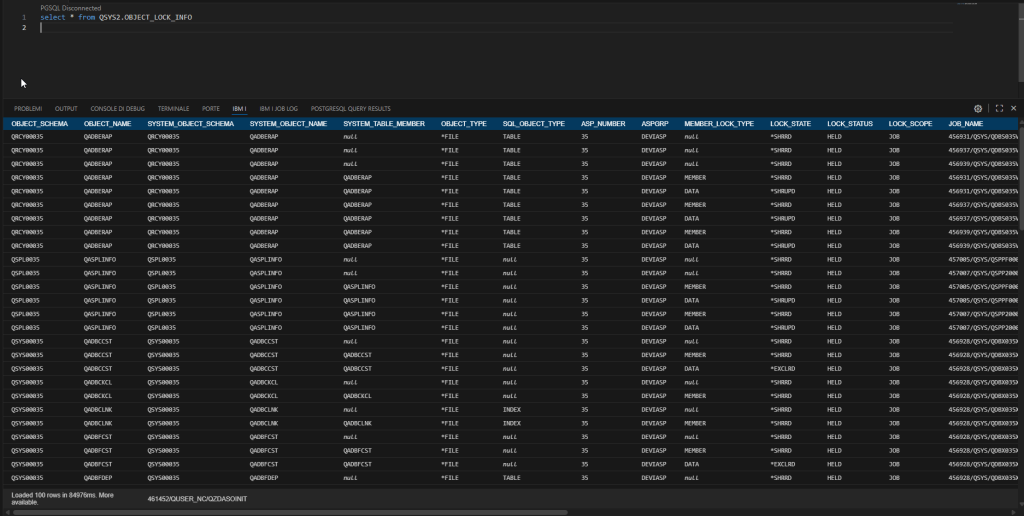
As you can see, it gives us a lot of information. Let’s go back for a moment to the customer’s primary need, which is to understand who placed blocks on a specific object and when, so we’ll start modifying the query. In this case, we’ll take less information, so I’ll select only a few fields: SELECT SYSTEM_OBJECT_SCHEMA, SYSTEM_OBJECT_NAME, SYSTEM_TABLE_MEMBER, OBJECT_TYPE, ASPGRP, MEMBER_LOCK_TYPE, LOCK_STATE, LOCK_STATUS, LOCK_SCOPE, JOB_NAME, PROGRAM_LIBRARY_NAME, PROGRAM_NAME, MODULE_LIBRARY_NAME, MODULE_NAME, PROCEDURE_NAME, STATEMENT_ID, CURRENT TIMESTAMP AS TIMESTAMP FROM QSYS2.OBJECT_LOCK_INFO WHERE SYSTEM_OBJECT_SCHEMA='XXXXXX' AND SYSTEM_OBJECT_NAME='XXXXX'
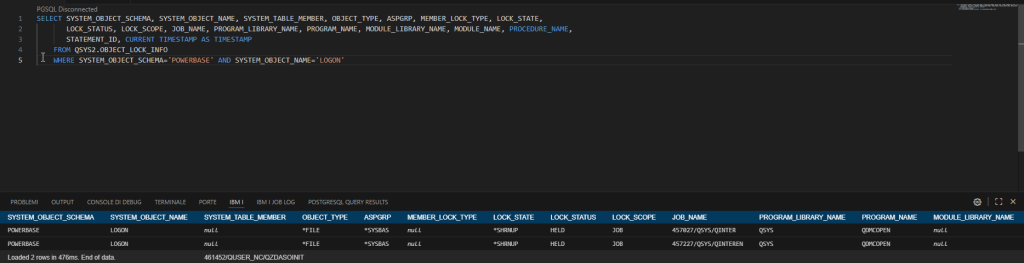
In my example, I took the display file for my system signon.
Okay, now that I’ve written the basic query, I’m ready to start the procedure.
- Input parameters
- Library name
- Object name
- Object type
- Analysis duration
- Analysis output file library
- Analysis file name
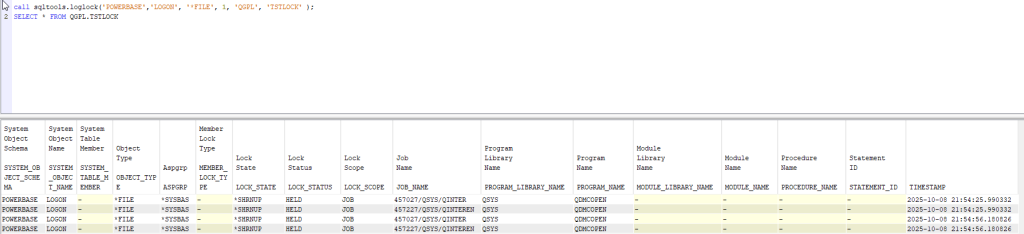
- Procedure body: first, I create the template file (the create table with no data) that I will use later to make all the entries I see. After that, I cycle until I have reached the time required for the analysis passed as a parameter. During this cycle, I insert the data extracted directly with the select into the temporary file I created earlier. I chose to run the analysis every 30 seconds, but feel free to change this time. Once I have reached the time I set, I copy all the output to the file that I passed as a parameter to the procedure
- Calling the procedure: you can call it from RUN SQL SCRIPTS/STRSQL/VS CODE/RUNSQL, here you can find an example, let’s consider that if you want to run this analysis for a long time, is better to submit it in batch.
Here you can find my code:
You need to be carefull! The query that I wrote works on every release >=7.5 because of the where statement. As you can see it’s quite complicated, and this kind comparison in where clause is not supported on older release, so, as I said a lot of time, PLEASE STAY CURRENT.
Andrea