One of the most important allies of a sysadmin is a good monitoring system.
In this first tutorial, I will show you how it’s so easy implementing an IBM i system monitor using features that are already included in the OS without using third part software.
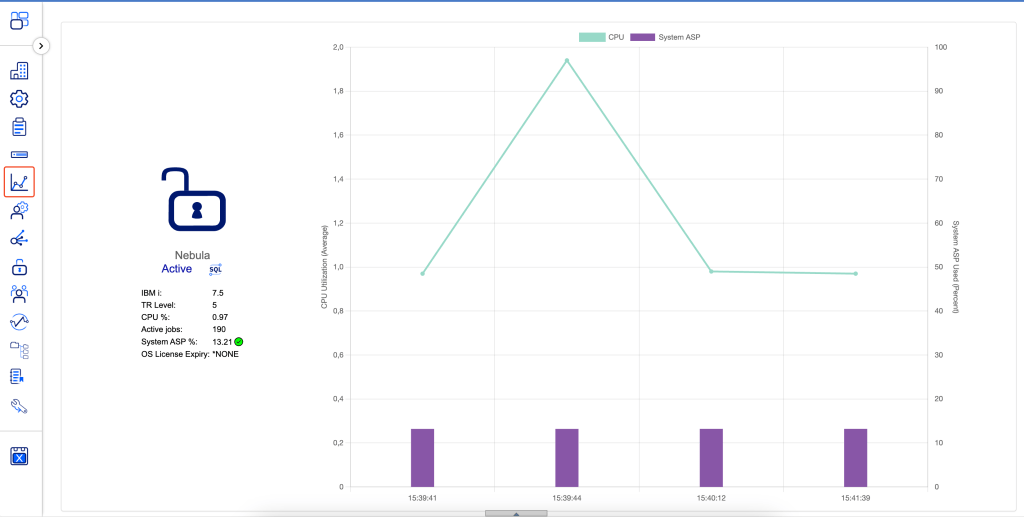
To do that, we are going to use IBM Navigator for i, so once connected please click on the icon below and choose SYSTEM MONITORS:

At this point, you are able to see active monitors (if you there are any) or you can proceed configuring one new. Let’s consider that nowadays there is quite a little set of metrics that you can use for your own monitoring tool. Some days ago I created a new idea to ask IBM to give the opportunity to create your own metrics by using SQL, here you can find the link to my idea, if you find it interesting please vote that.
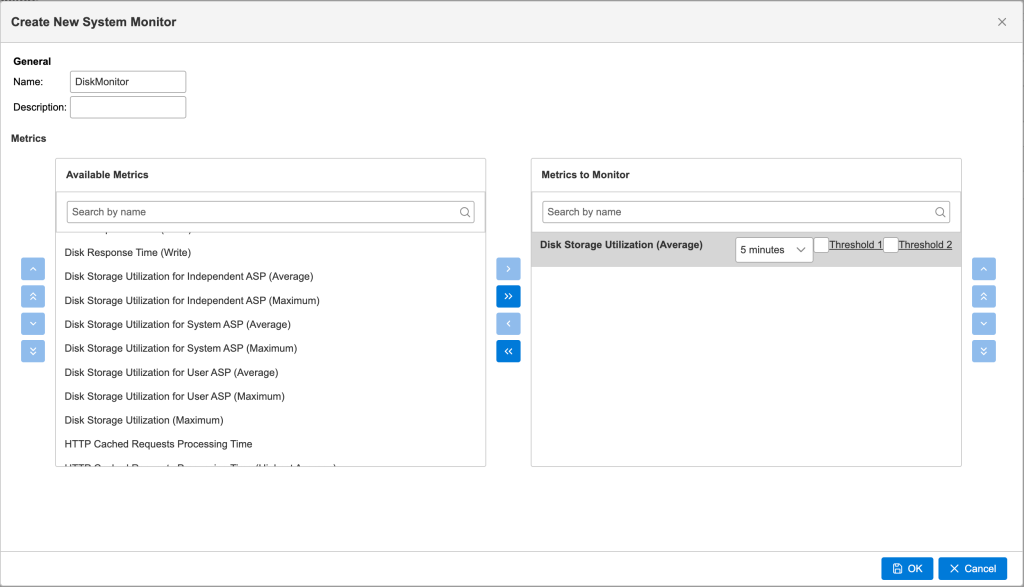
So let’s start with a simple monitoring example; so I want to create a monitor that must control my disk space utilization… So, from the drop-down list, choose CREATE NEW SYSTEM MONITOR. Once clicked, choose Disk Storage Utilization (average) from the metric list and after that you have to choose the frequency of the check, in my example I’ve chosen 5 minutes.

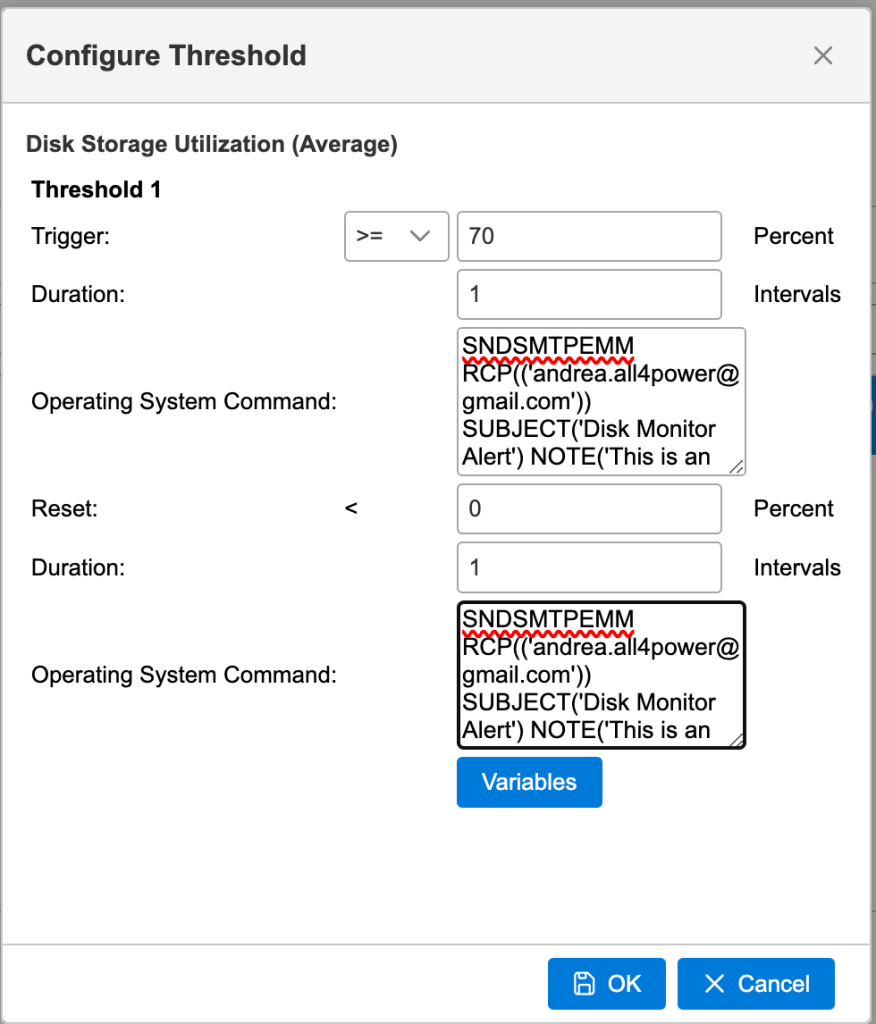
Now that we have chosen what kind of metric I want to use and the frequency of the check, we only need to set of thresholds, and we have to define what happens when the threshold has been reached using OS commands.
In my case, I will define one threshold that is triggered when disk is used more than 70% for more than two intervals. When the condition is verified, monitor will email me:

As you probably understand, you can define a combination of metrics monitored in the same “check”.
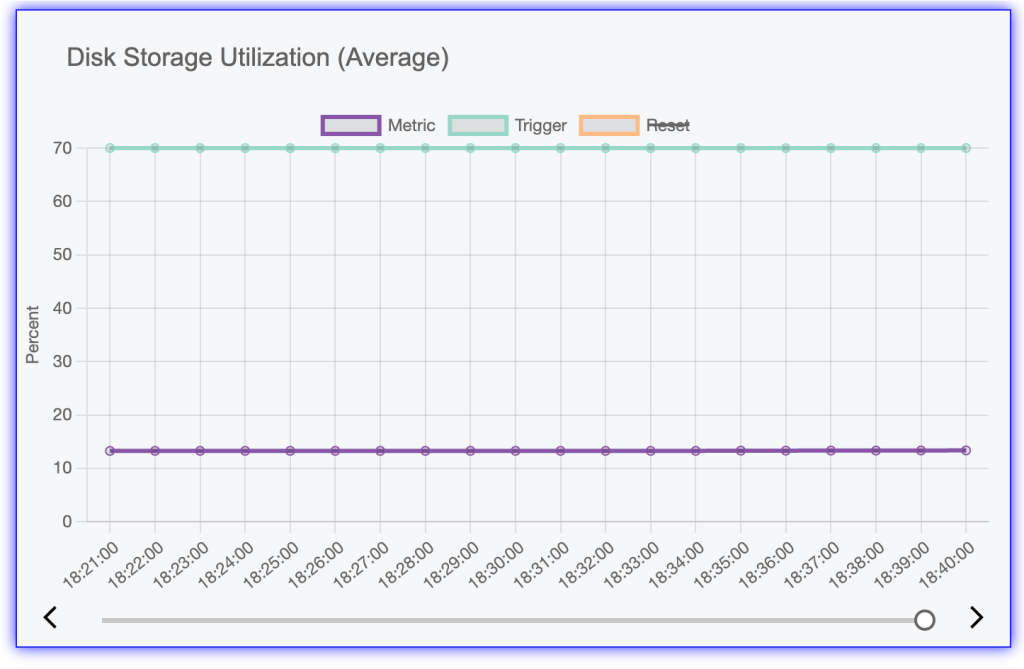
Consider that once you enable your monitoring, automatically the system starts probing the system status according to what you set. This data is stored and can be analysed by graph; this is a very convenient feature if you want to check the data over the long term to determine, for example, whether there are any growth trends. It is also possible to check monitoring log, you can also see when some threshold as been reached.
Here you can find an example of monitoring graph:

I will put another post on this blog about message monitoring.
Andrea

Andrea,
very interesting.
How long does the data remain available for consultation?
Thank you in advance
Regards
Daniele
Hi Daniele,
all this data are stored into performance data, so they will have the same retention.
Thank you for your question
GJ!
Is it avaible?