This week, a customer opened a ticket complaining that there were too many job logs on their system… this meant that when a user searched for their print job with WRKSPLF, they were inundated with a considerable number of job logs, making it difficult to find the relevant spool.
While I find the spool tool relatively convenient, I often see customers using OUTQs as archives. Let’s be clear: OUTQs are not archives! There are different tools that can perform that function. Moreover, for a sysadmin, the spool is an enemy of performance. Replication tools, for example, replicate one spool at a time. Last year, during the migration of an important customer, we found ourselves having to change the migration method due to poor performance in spool restores (and the customer had about 10 million of them).
Let’s get back to the matter at hand… now, the conditions that can cause a job to leave the log are:
4 0 *SECLVL, and here we need to investigate whether it is the jobd that passes this parameter when starting the job or whether it is modified later with CHGJOB
DSPJOBLOG OUTPUT(*PRINT), again, the configuration specified in the job is overridden by printing it with the execution of that command
SIGNOFF LOG(*LIST), applies only to interactive sessions and ensures that when the interactive session is closed, it leaves the job log
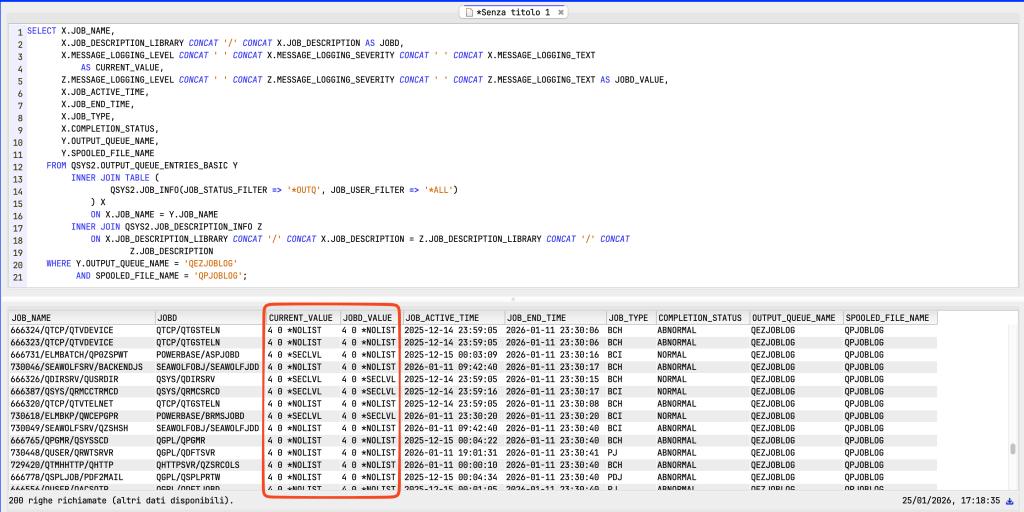
Now, how can I find out the possible cause for the job logs? SQL can be very useful in this case too. In the query example below (you can find the query on my Gist at the following link), I join the OUTPUT_QUEUE_ENTRIES_BASIC view (to extract only jobs with QPJOBLOG files in the QEZJOBLOG print queue) with the JOB_INFO view view (to extract the job execution parameters) and the JOB_DESCRIPTION_INFO view to see the logging parameters in the jobd.
Therefore, if both the jobd and the job have 4 0 *SECLVL as their logging parameter, it means that the job has maintained the settings defined by the jobd. If, on the other hand, the jobd reports a different value but the job maintains 4 0 *SECLVL, then it may mean that the job was submitted with a different parameter or that the job execution parameters were changed with the CHGJOB command. If the job value is also different from 4 0 *SECLVL and the job is a batch job, a DSPJOBLOG OUTPUT(*PRINT) has been performed. If it is interactive, the same reasoning is likely to apply, although it is possible to specify SIGNOFF LOG(*LIST).
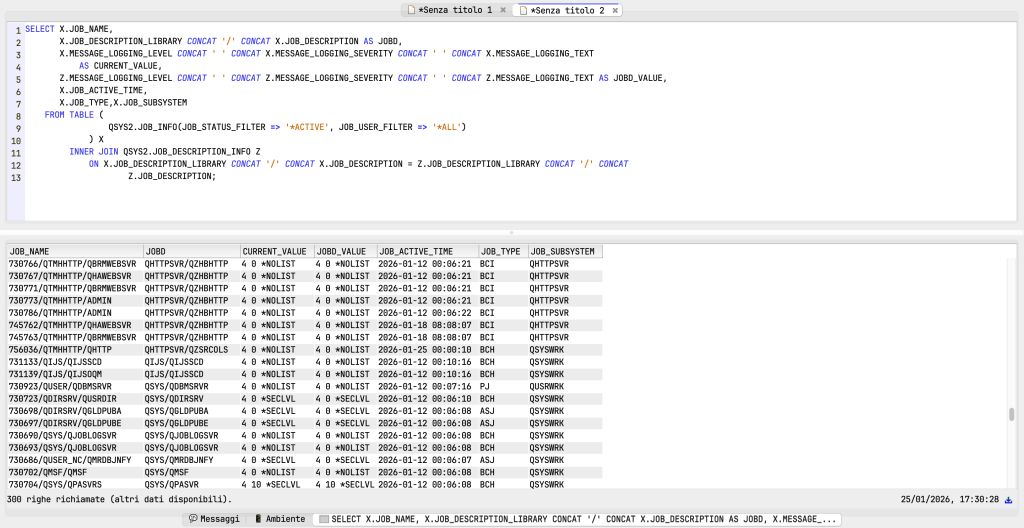
What if I want to analyse active jobs? Well, in this case, the query changes slightly, as there will most likely be no spool…
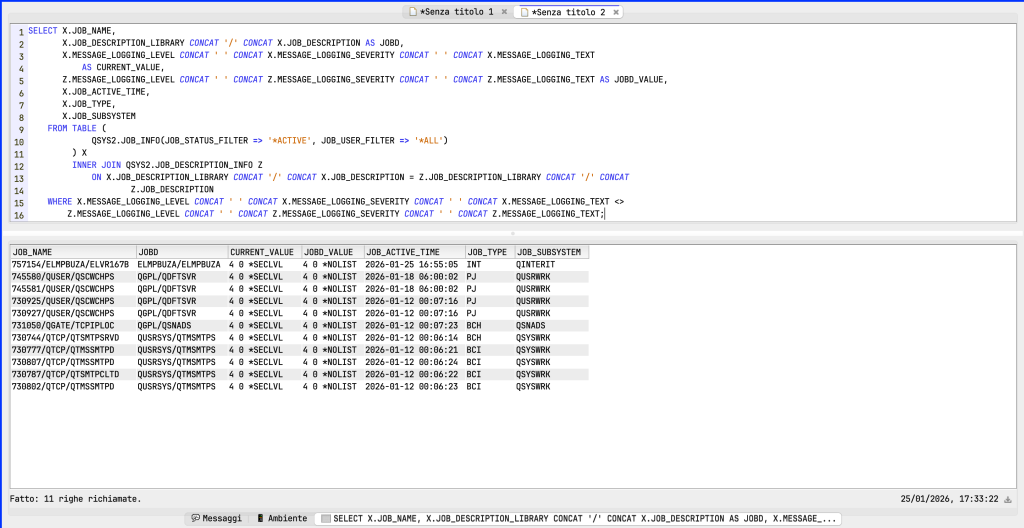
Or, if I want to check only job with defference between current settings and JOBD:
And you, have you ever considered using SQL for this type of analysis? I remind you that all the code is available on my GIST, which you can access at this link: https://gist.github.com/buzzia2001
During the Christmas holidays, between various lunches with relatives, an outing, and, of course, some rest, I had the opportunity to rework the Code4i FS extension a bit. It was very challenging in that it allowed me to learn a new language, TypeScript, and to learn about new aspects and SQL services of the IBM i operating system that I was completely unaware of before.
For those unfamiliar with it, this extension allows you to use and, in some cases, even manage additional objects beyond those traditionally supported by the standard extension. The aim is to improve the user experience for programmers (but not only them) by providing a single interface from which to work and get feedback, avoiding the need to switch frantically between applications. In addition, it is intended as a tool to help those who are just starting out and therefore have less experience, as the GUI greatly simplifies things.
New supported object types are 20, here you can find a list with the major features:
Data Queue
Send Message: Keyed/non-keyed support, UTF8 format, length validation, key validation
Clear Queue: Removes all messages with confirmation
View: Program info, bound modules with source details, bound service programs with signatures, exported procedures (SRVPGM only), SQL settings, optimization details, activation group
Query Definition
Translate to SQL: Converts Query/400 definitions to SQL format using RTVQMQRY command
View: SQL translation of query definition with proper table notation (LIB.FILE instead of LIB/FILE)
Note: Uses temporary source file and alias for extraction, automatically cleans up temporary objects
I would like to point out that this is not the final version; it is currently being reviewed by the Code4i team as the extension is part of that ecosystem. It is therefore possible that it may undergo further changes. However, it would be interesting for other users to be able to test it now in ALPHA so that any bugs can be checked and corrected, as well as to gather feedback on new features. So, if you want to be a tester, write a comment and I’ll get back to you with instructions.
It is quite common to have customers with specific backup requirements, such as changing the expiration date of the tape used based on the day of the month or year for tax purposes. For this reason, it is always complicated to have standard jobs or calendars with a predefined retention period.
So if a standard approach is not feasible, we go for a custom approach… Now SQL and BRMS come to our aid. In fact, there are several SQL services compatible with 5770BR1, and even more with 5770BR2.
Now, let’s proceed with creating an SQL procedure that modifies the media class, move policy, and retention for the tapes used in the job in which it is launched. Then, let’s extract the queries we need:
Find the current job: select job_name from TABLE (QSYS2.ACTIVE_JOB_INFO(DETAILED_INFO => 'NONE', JOB_NAME_FILTER => '*'))
Find tapes and creation date: select volume_Serial, created from qusrbrm.media_info
Find job that changes a tape: select tmcvsr, TRIM(LPAD(TMJNBR, 6, '0') CONCAT '/' CONCAT TRIM(TMUSER) CONCAT '/' CONCAT TRIM(TMCJOB)) from qusrbrm.qa1amm
Now, let’s create a query that give us serial number and the new expiration date: SELECT VOLUME_SERIAL, CASE WHEN RETENTION <> 9999 THEN TO_CHAR(CREATED + RETENTION DAYS, 'ddMMyy') ELSE 'PERM' END FROM QUSRBRM.MEDIA_INFO INNER JOIN QUSRBRM.QA1AMM ON VOLUME_SERIAL = TMCVSR INNER JOIN TABLE (QSYS2.ACTIVE_JOB_INFO(DETAILED_INFO => 'NONE', JOB_NAME_FILTER => '')) ON TRIM(JOB_NAME) = TRIM(LPAD(TMJNBR, 6, '0') CONCAT '/' CONCAT TRIM(TMUSER) CONCAT '/' CONCAT TRIM(TMCJOB))
So, in our case, we have RETENTION that is a variable that contains the number of days to maintain the tape active, 9999 is a special value that in my case means that the tape should not have an expiration date.
At this point, it’s all very easy. I just have to loop through the result set and run the CHGMEDBRM command with the correct parameters for media class, move policy, and retention.
As usual, you can find the source code for the procedure, download it, and edit it as you wish.
In recent days, thanks to the summer break taken by many customers, I had the opportunity to test some new tools and products that I had always wanted to try but never had the chance to. One of the tools on my list was Migrate While Active, option 2 of the DB2 Mirror product (5770DBM).
There are some differences between option 1 (the real DB2 mirror) and option 2 (Migrate While Active or MWA), there are some differences both from a technological point of view (option 1 requires RDMA technology while option 2 only requires TCP connectivity between the two systems) and from the point of view of the product’s purpose (option 1 provides high reliability on two active nodes, option 2 is not a high-reliability tool, it is used to migrate systems).
Now, the curiosity about this tool stems from the fact that one of the tasks we perform daily within my organisation is the design and completion of migrations from customer data centres to our data centre, and as everyone can imagine, the less Mr Business stops, the happier customers are, especially in a complex phase such as the migration of a production system.
With the aim of reducing machine downtime, I jumped at the new methodology released with level 27 of the DB2 Mirror group for 7.4, which effectively uses data replication technologies managed directly by the operating system without going through a shutdown for global (or partial) machine backup. So let’s have a look at the requirements:
OS V7R4M0 (at the moment, this feature supposed to be planned in the autumn for newer releases)
Group SF99668 level 27
Empty target partition with same LIC level as production
Discrete amount of bandwidth to use for replication
Let’s get started! For my test, I cloned an internal production machine with a capacity of approximately 1.5TB of data, 1 Power 9 core, and 32GB of RAM. My goal was to replicate this machine from the primary datacentre to the datacentre we use for disaster recovery. The two datacentres are directly connected from a network perspective, so I had plenty of bandwidth available. Once the clone was created and updated with PTF, I was ready to start replicating. I also had to install another IBM i system with the *BASE option of product 5770DBM so that I could use the GUI.
Now, on the dr site, I created a partition of similar size and installed the LIC version that was also present on the production system (for this reason, I updated the ptfs on the initial clone, in order to use the latest LIC resave). Once the LIC installation is complete, we are ready to start the replication.
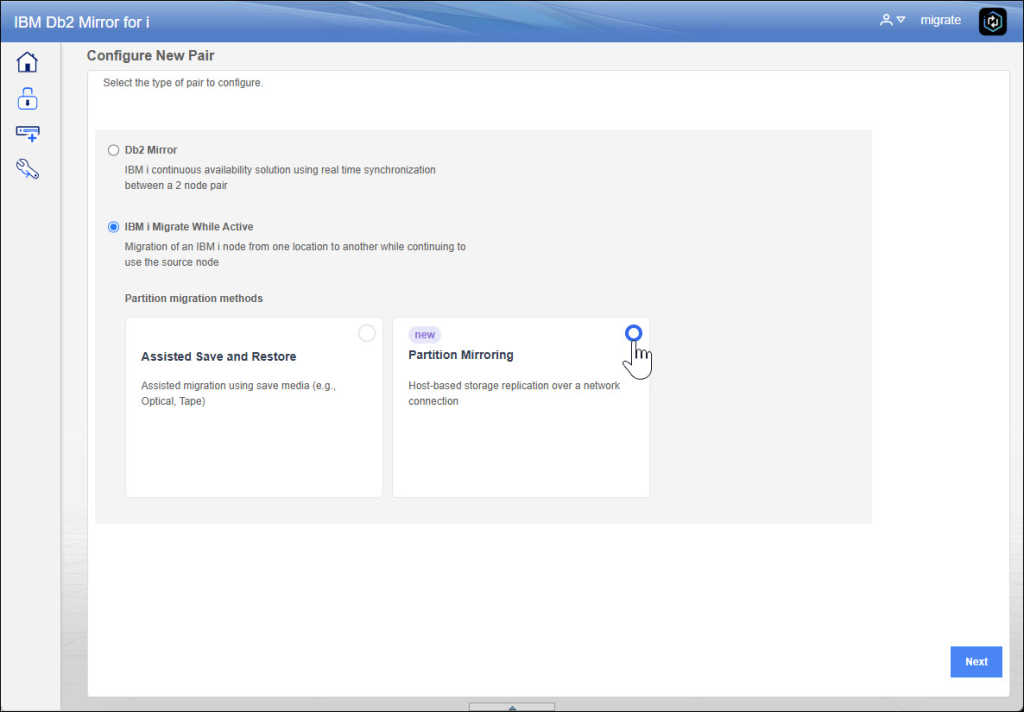
You need to access to the webgui (https://guiserver:2010/Db2Mirror) and also you need to click on “CONFIGURE NEW PAIR”, now we’ll choose Partition Mirroring:
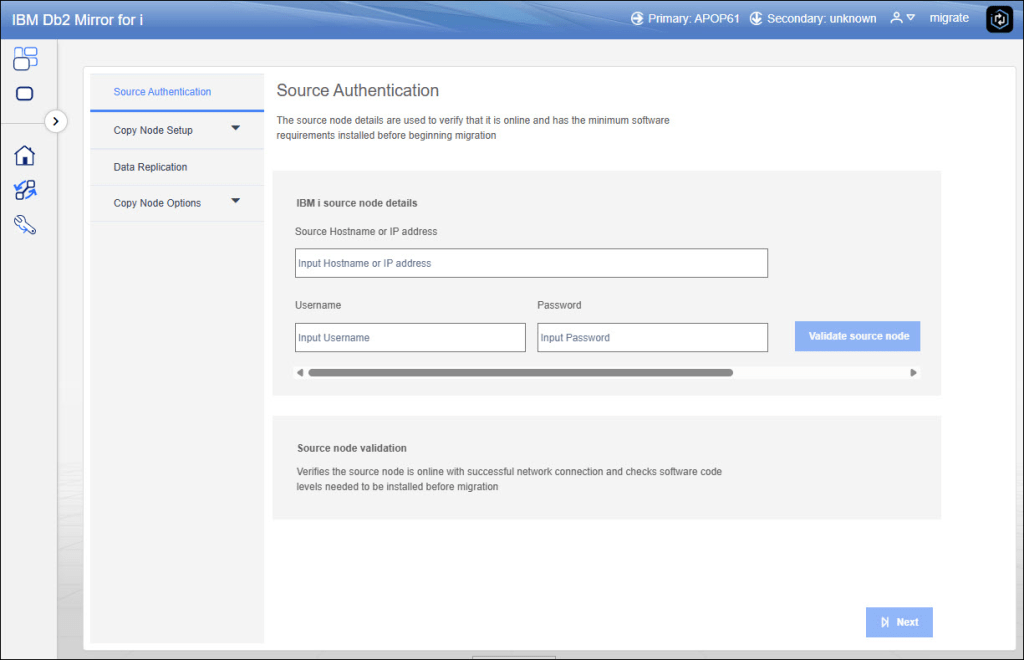
Once checked Partition Mirroring, we need to insert information about source node, these credentials is used to check if all requirements are fulfilled:
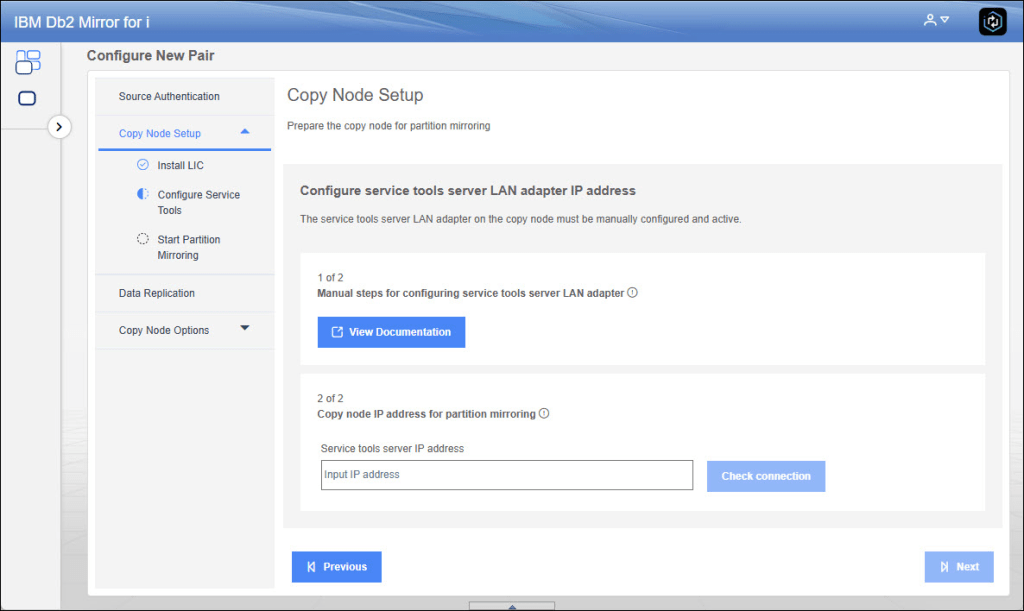
In my case, LIC has been already installed on the target node so you can proceed to the Service Lan Adapter from DST (here the full guide). When the adapter configuration is ended we can proceed in the wizard putting target ip address:
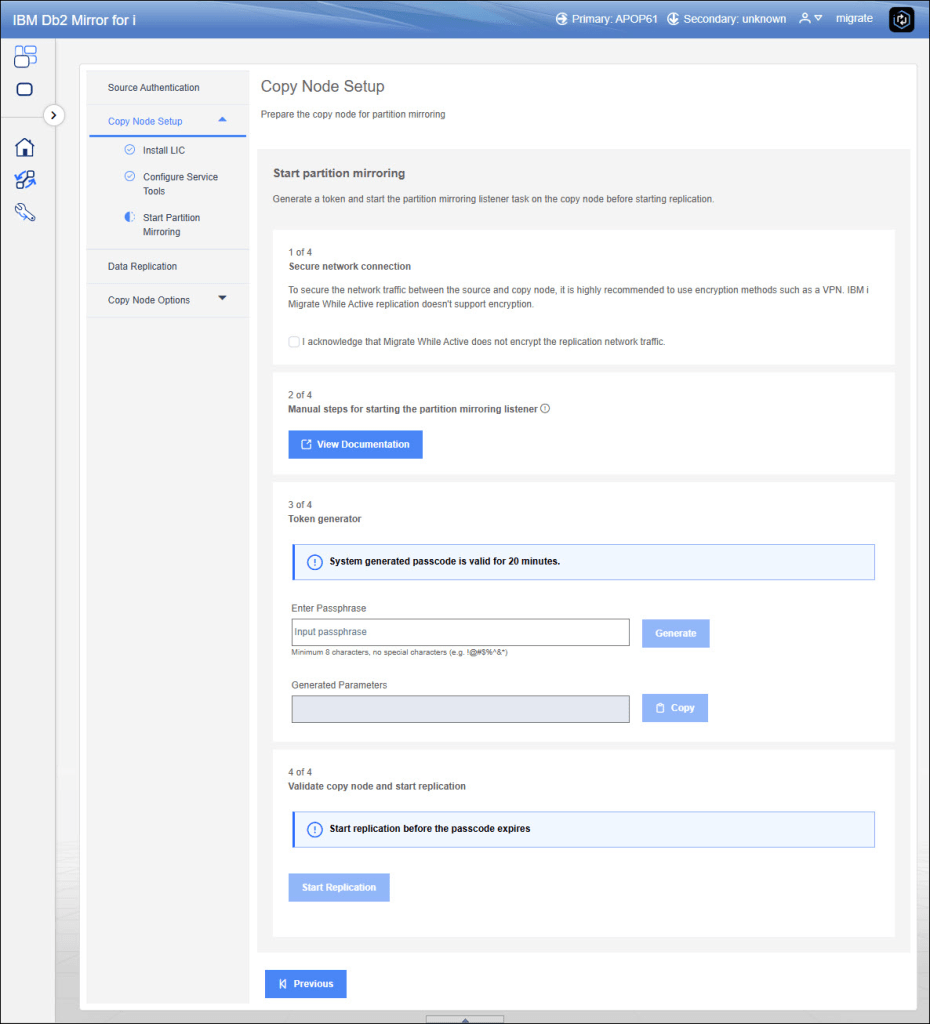
As you understand, in the target node there is no OS, no TCP services, it is a low level communication. In fact in the next step you need to generate a key from the GUI that allows source and target communication, this key should be inserted in a DST macro (here the full documentation).
If you have already performed actions on the DST, we are able to start replication:
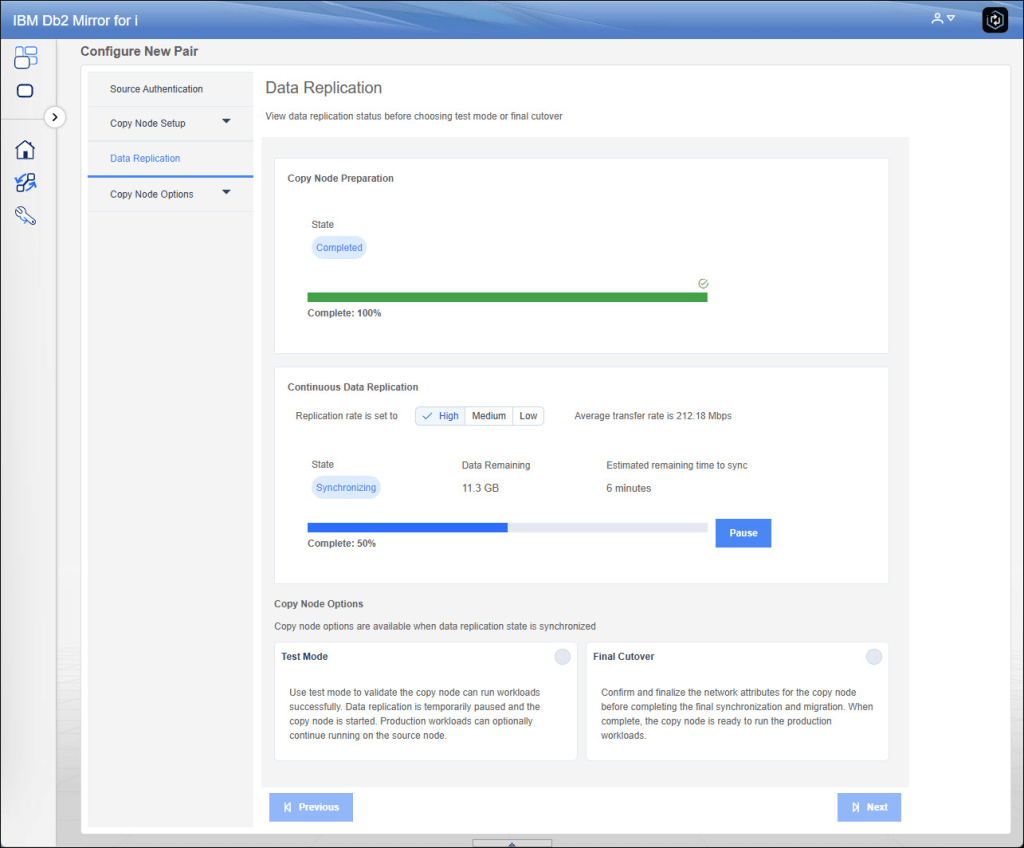
As you can imagine, at this point the sysbas synchronization phase begins, during which all data must be transferred and applied to the target replication system. As mentioned a few moments ago, this technology is only valid for sysbas; for iASP, the features already incorporated into PowerHA remain. The system replication is total, so it is not possible to partially replicate by indicating what to replicate and what not to replicate.
One of the real gems of this tool, however, is the ability to preview the consistency of the system. Once the systems are synchronized, it will be possible to activate a test mode in which replication will be suspended and both systems will track data modification activities: the source to know what to send to the target site and the target to know how to roll back the changes once testing is complete. The test mode will depend on the requirements of the various end users. It can be activated with a different network setup or with the same IP as production (clearly, at least the interface on the latter will have to be closed to avoid duplicate IPs). Once you are ready to perform the CUTOVER, disk writes to production will be suspended, pending transactions will be applied on the target, and then the target partition will be restarted with the specified network settings. In all phases you know how much time is required.
Unfortunately, this test did not provide me with any significant benchmarks. The machine was still a clone, and although the batches ran continuously, there were no interactive features or interfaces with other external systems, so the workload was not comparable to production. However, it was possible to migrate a system of approximately 1.5TB in about 6 hours. During those 6 hours of maximum priority replication (it is possible to specify priorities so as not to impact performance too much), the system was using 1 full core (Power9) and about 200mbps. In 6 hours, I would have been able to migrate my system to another datacentre, and the great thing is that all this without the initial downtime to make the backup… in fact, the only downtime is that of migration one. Clearly, this type of solution requires good computing power and bandwidth, which initially allows the complete system to be brought online and then keeps the two environments aligned.
And you, do you have opportunity to test this kind of software or related?
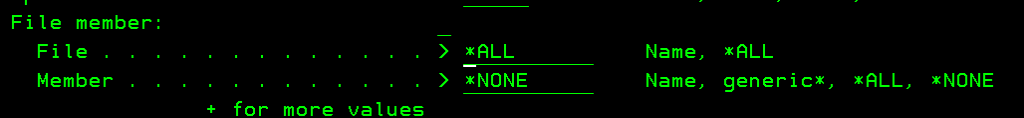
This week, I received a request from a customer to create a batch procedure that would restore files from the production environment to the test environment without transferring members due to disk space limitations. It seemed like a simple task, as the operating system allows this without any problems using the native RSTOBJ command thanks to the FILEMBR((*ALL *NONE)) parameter:
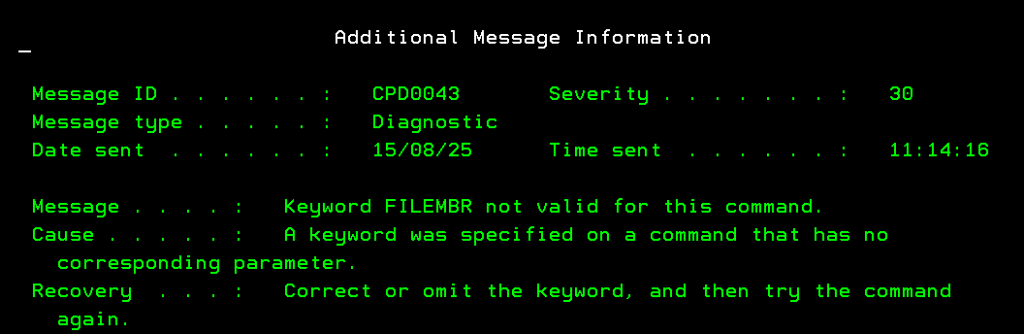
As mentioned above, it seemed simple, but the BRMS commands do not support this functionality. Let’s look at the RSTOBJBRM command, for example… If I try to pass it the parameter name, I get this error, precisely because the parameter does not exist in this case:
When talking to IBM support, I was told that the only solution at the moment to achieve my goal of restoring without members was to concatenate the native command with the information contained within the BRMS DB. This gave me the idea of creating a simple SQL procedure that would allow me to achieve my goal. Clearly, it was also feasible in other languages; I could have achieved the same result with an RPG programme. The choice of SQL was dictated by the need to find a quick alternative that did not require a great deal of development effort.
Let’s start with what we need… Let’s assume that the list of objects to be restored and the library in which they are located are passed as parameters, and let’s also assume that the library in which the restoration is to be performed is also passed as a parameter to the function. Now, what we need to calculate are the tape on which they are saved, the sequence (although we could use the *SEARCH parameter) and the device to be used for the restore.
Now, if you are using product 5770BR2 (with the most recent PTF), extracting this information is quite simple. In fact, there is a view in QUSRBRM called backup_history_object that returns information about the various saved objects. Alternatively, if you are using 5770BR1, you will need to query the QA1AHS file.
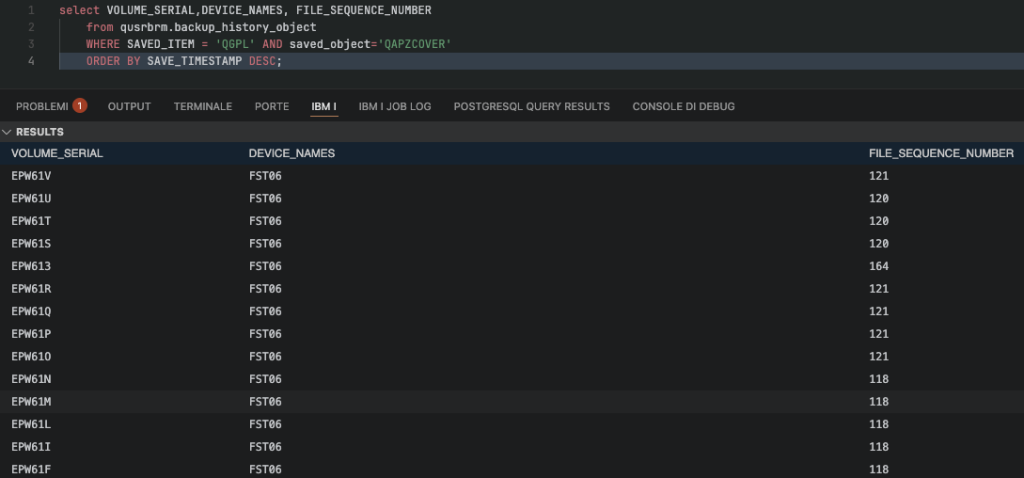
For example, we want to find media information for objects in QGPL (I will use QAPZCOVER as example)…
With 5570BR2 the SQL statement is: select VOLUME_SERIAL,DEVICE_NAMES, FILE_SEQUENCE_NUMBER from qusrbrm.backup_history_object WHERE SAVED_ITEM = 'QGPL' AND saved_object='QAPZCOVER' ORDER BY SAVE_TIMESTAMP DESC
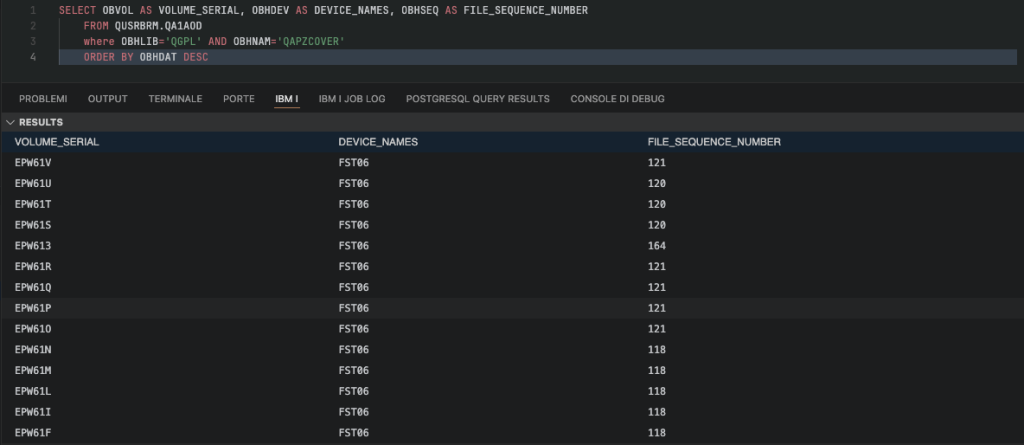
If you are using 5770BR1: SELECT OBVOL AS VOLUME_SERIAL, OBHDEV AS DEVICE_NAMES, OBHSEQ AS FILE_SEQUENCE_NUMBER FROM QUSRBRM.QA1AOD where OBHLIB='QGPL' AND OBHNAM='QAPZCOVER' ORDER BY OBHDAT DESC
As you can see, the result is the same regardless of which of the two queries you use.
Now, in my case, I needed the most recent save, so I applied a LIMIT 1 in my function, sorting in descending order by save date (so I inevitably get the most recent save). If you also want to parameterise the date, you simply need to add a parameter to the procedure and add a condition to the WHERE clause.
Now we are ready to create our procedure: in the first stage we will create RSTOBJ command retrieving data from QUSRBRM, after that we will use SYSTOOLS.LPRINTF to write command executed on the joblog and after that we will execute command using QSYS2.QCMDEXC procedure. In my case, the RSTLIB parameter is optional, by defualt is *SAVLIB:
SET PATH "QSYS","QSYS2","SYSPROC","SYSIBMADM" ;

CREATE OR REPLACE PROCEDURE SQLTOOLS.RSTNOMBR2 (
	IN OBJLIST VARCHAR(1000) ,
	IN LIB VARCHAR(10) ,
	IN RSTLIB VARCHAR(10) DEFAULT  '*SAVLIB' )
	LANGUAGE SQL
	SPECIFIC SQLTOOLS.RSTNOMBR2
	NOT DETERMINISTIC
	MODIFIES SQL DATA
	CALLED ON NULL INPUT
	SET OPTION  ALWBLK = *ALLREAD ,
	ALWCPYDTA = *OPTIMIZE ,
	COMMIT = *NONE ,
	DECRESULT = (31, 31, 00) ,
	DYNDFTCOL = *NO ,
	DYNUSRPRF = *USER ,
	SRTSEQ = *HEX
	BEGIN

DECLARE CMD VARCHAR ( 10000 ) ;

SELECT
	'RSTOBJ OBJ(' CONCAT TRIM ( OBJLIST ) CONCAT ') SAVLIB(' CONCAT TRIM ( LIB ) CONCAT ') DEV(' CONCAT TRIM ( OBHDEV ) CONCAT ') SEQNBR('
	CONCAT OBHSEQ CONCAT ') VOL(' CONCAT TRIM ( OBVOL ) CONCAT ') ENDOPT(*UNLOAD) OBJTYPE(*ALL) OPTION(*ALL) MBROPT(*ALL) ALWOBJDIF(*COMPATIBLE) RSTLIB('
	CONCAT TRIM ( RSTLIB ) CONCAT ') DFRID(Q1ARSTID) FILEMBR((*ALL *NONE))'
INTO CMD
FROM QUSRBRM.QA1AOD WHERE OBHLIB = TRIM ( LIB ) ORDER BY OBHDAT DESC LIMIT 1 ;

CALL SYSTOOLS . LPRINTF ( TRIM ( CMD ) ) ;
CALL QSYS2 . QCMDEXC ( TRIM ( CMD ) ) ;

END  ;
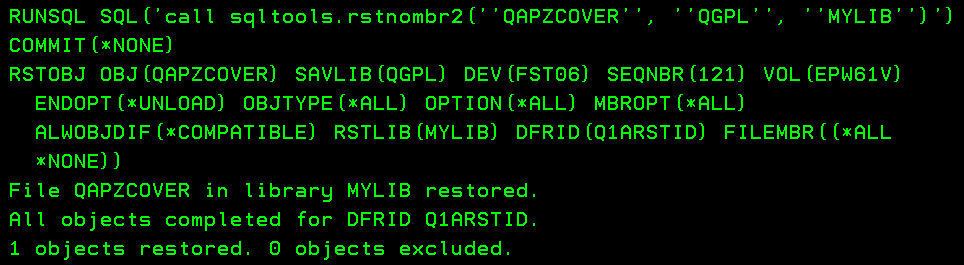
Ok, when we have created this procedure we are also ready to test it… From 5250 screen you can use this command: RUNSQL SQL('call sqltools.rstnombr2(''QAPZCOVER'', ''QGPL'', ''MYLIB'')') COMMIT(*NONE)
This is the result:
If you put this command in a CL program you are able to perform this activity in a batch job. Also in this way you are able to make the restore from systems in the same BRMS network if they are sharing media information, in that case you should query QA1AHS instead because object detail is not shared.
Syslog, short for System Logging Protocol, is one of the cornerstones of modern IT infrastructures. Born in the early days of Unix systems, it has evolved into a standardized mechanism that enables devices and applications to send event and diagnostic messages to a central logging server. Its simplicity, flexibility, and widespread support make it indispensable across networks of any scale.
At its core, Syslog functions as a communication bridge between systems and administrators. It allows servers (also IBM i partitions), routers, switches, and even software applications to report what’s happening inside them—be it routine processes, configuration changes, warning alerts, or system failures. It is also possible that these messages are transmitted in real time to centralized collectors, allowing professionals to stay informed about what’s occurring in their environments without needing to inspect each machine individually.
This centralized approach is critical in environments that demand security and reliability. From banks to hospitals to government networks, organizations rely on Syslog not just for operational awareness but also for auditing and compliance. Log files generated by Syslog can help trace user activities and identify suspicious behavior or cyberattacks. That makes it an essential component in both reactive troubleshooting and proactive monitoring strategies.
So, in IBM i there al least three places in which you are able to generate Syslog.
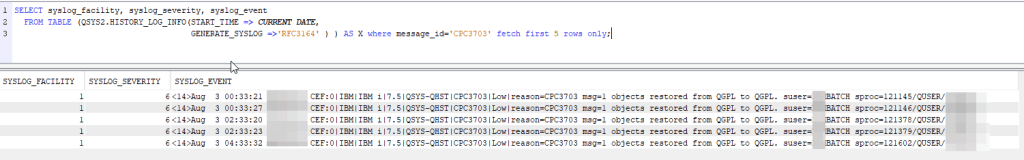
The first place where you can extract syslog format is the system log. The QSYS2.HISTORY_LOG_INFO function allows you to extract output in this format. In my example, I want to highlight five restore operations performed today: SELECT syslog_facility, syslog_severity, syslog_event FROM TABLE (QSYS2.HISTORY_LOG_INFO(START_TIME => CURRENT DATE, GENERATE_SYSLOG =>'RFC3164' ) ) AS X where message_id='CPC3703' fetch first 5 rows only;
By changing the condition set in the where clause it is possible to work on other msgids that could be more significant, for example it is possible to log the specific msgid for abnormal job terminations (since auditors enjoy asking for extraction on error batches).
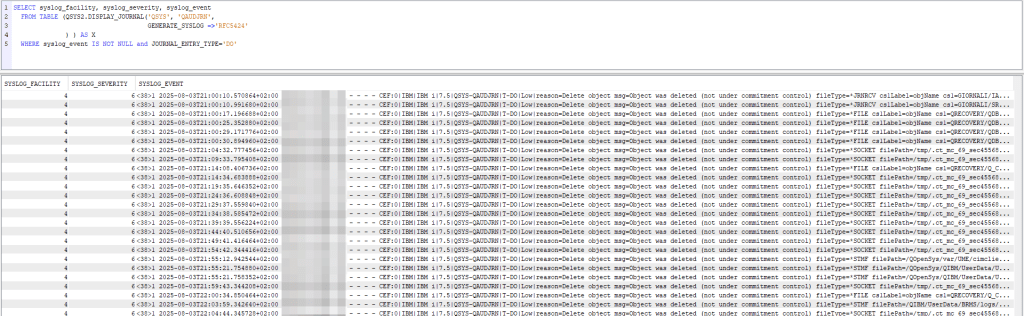
The second tool that could be very useful is the analysis of journals with syslog, in fact the QSYS2.DISPLAY_JOURNAL function also allows you to generate output in syslog format. In my example, I extracted all audit journal entries (QSYS/QAUDJRN) that indicated the deletion operation of an object on the system (DO entry type): SELECT syslog_facility, syslog_severity, syslog_event FROM TABLE (QSYS2.DISPLAY_JOURNAL('QSYS', 'QAUDJRN',GENERATE_SYSLOG =>'RFC5424') ) AS X WHERE syslog_event IS NOT NULL and JOURNAL_ENTRY_TYPE='DO';
Of course, it is possible to extract entries for any type of journal, including application journals.
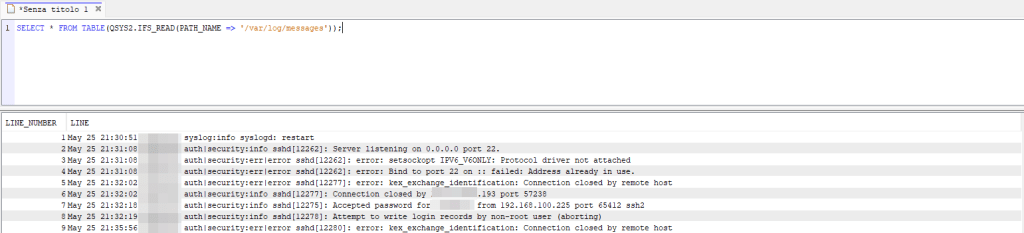
The last place that comes to mind is the system’s syslog service log file. In a previous article, we saw how this service could be used to log SSH activity. In my case the log file is located under /var/log/messages, so with the QSYS2.IFS_READ function I can read it easily: SELECT * FROM TABLE(QSYS2.IFS_READ(PATH_NAME => '/var/log/messages'));
These are just starting points… as mentioned previously, these entries are very important for monitoring events that occur on systems. Having them logged and stored in a single repository for other platforms can make a difference in managing attacks or system incidents in general.
Do you use these features to monitor and manage events on your systems?