More and more frequently customers are reporting to us that after upgrading to Windows 11 24H2 there are problems with connecting to network shares via Netserver.
Small parenthesis, in itself, the fact that the IFS of an IBM i system is accessible is a great thing, but you have to be extremely careful about what you share and with what permissions you do it. Frequently I see that on systems there is root ( / ) shared read and write, this is very dangerous because in addition to IFS you can browse the other file systems on our systems such as QSYS.LIB and QDLS. So try if possible to share as little as possible with as low permissions as possible. Closing parenthesis.
Returning to the initial issue, indeed it seems that Microsoft with its update (now released a few months ago) has added issues related to the support of certain characters in IFS filenames. Thus, if a folder contains a file with the name consisting of one of the offending special characters, Windows loses access to that folder. The characters that generate these problems are the following: < (less than)
(greater than)
: (colon)
“ (double quote)
/ (forward slash)
\ (backslash)
| (vertical bar or pipe)
? (question mark)
* (asterisk)
Here, as indicated in this IBM documentation link, changing the file names by removing the famous characters will restore access to shared folders. Now, clearly in a production context it is imaginable that there are several shared folders and that IFS is an infinitely large place with infinite files (most of the time abandoned :-D), so it is necessary to find a clever way to check in which shared folders we might have problems. To do this we will rely on two SQL views, the first we need to list the list of folders we are sharing, the second we need to list the paths that contain special characters inside them.
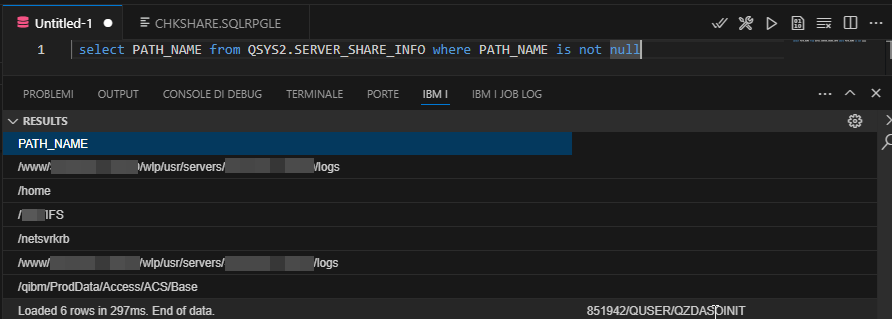
Thanks to the QSYS2.SERVER_SHARE_INFO view, we will have the ability to list the paths that have been shared via netserver with the following query:
select PATH_NAME from QSYS2.SERVER_SHARE_INFO where PATH_NAME is not null
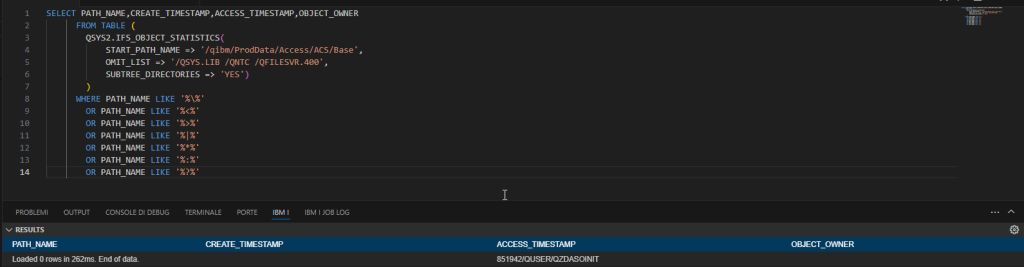
Now that we have the list of all directories shared, we only need to scan the content. Now that we have the list of all shared directories, we just need to analyze the contents. To do this we will use the procedure QSYS2.IFS_OBJECT_STATISTICS which takes as parameters the name of the starting path, any paths to be excluded and an indication of whether to proceed with scanning in the subdirectories, clearly in our case we will tell it to scan those as well. Now, we are not interested in taking all the files, but only those that contain special characters in their name that are not supported by Windows, for which we will apply a WHERE. Here is an example of the query on a small path (take care that this query could run for a lot of time):
SELECT PATH_NAME,CREATE_TIMESTAMP,ACCESS_TIMESTAMP,OBJECT_OWNER
      FROM TABLE (
        QSYS2.IFS_OBJECT_STATISTICS(
            START_PATH_NAME => '/qibm/ProdData/Access/ACS/Base',
            OMIT_LIST => '/QSYS.LIB /QNTC /QFILESVR.400',
            SUBTREE_DIRECTORIES => 'YES')
        )
      WHERE PATH_NAME LIKE '%\%'
        OR PATH_NAME LIKE '%<%'
        OR PATH_NAME LIKE '%>%'
        OR PATH_NAME LIKE '%|%'
        OR PATH_NAME LIKE '%*%'
        OR PATH_NAME LIKE '%:%'
        OR PATH_NAME LIKE '%?%'
In my example I took a fairly small path (the one with the ACS installer) and it took a short time. Moreover, no file contains any wrong characters so I can rest assured, in fact it did not return any rows.
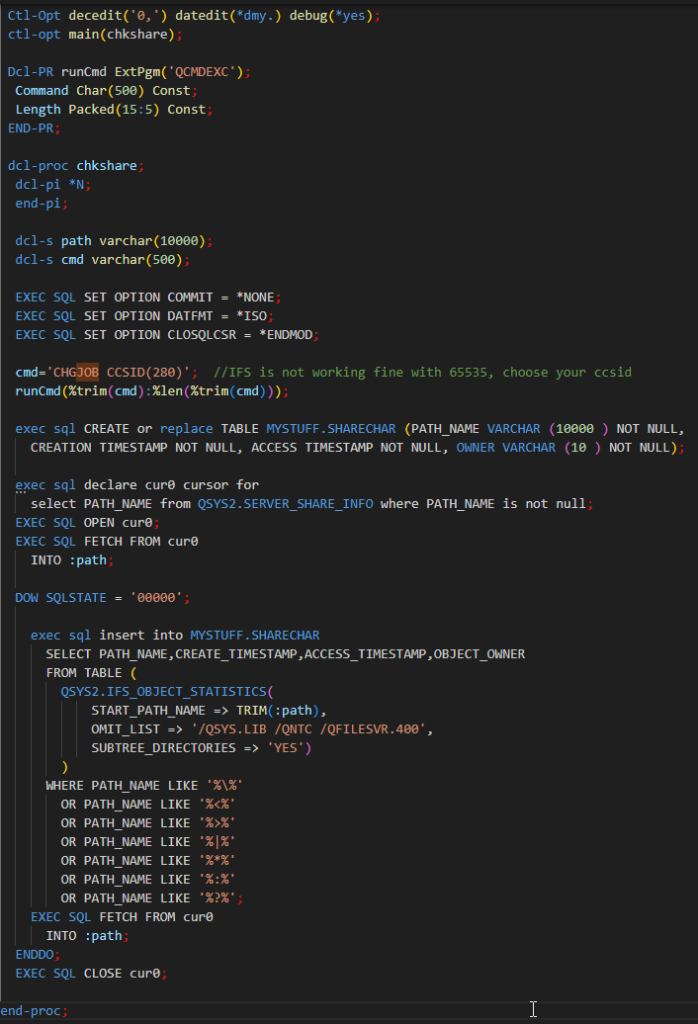
At this point, there is nothing left to do but combine the two queries into a very simple RPG program. Now, considering that the second scan query can take a long time, it is a good idea to submit its execution, saving the results in another table.
As you can see, my program is pretty short, only combining two easy queries, and in this way you are able to find every file that will break shares. At the end of the execution, please check MYSTUFF/SHARECHAR file, here you can find details about file as path name, owner, creation and last access timestamp.
Remember, this is SQL, so you can also change whathever you want such as column, destination file and so on.
I hope I give you a way to save you time with this that can be a rather insidious and annoying problem.
The past few days have been very full of announcements for IBM i system builders, in fact a new major release of the operating system was announced (strange since we are talking about an operating system that some people call dead :-D) namely IBM i V7R6M0. As enthusiastic as I am about it, I will wait to do an ad hoc article as soon as I have had the opportunity to test first-hand all the new features presented. In addition to version 7.6 last week the new Technology Refresh 6 was announced for version 7.5, again I am eager to see what new features they have thought of. A first alarm bell on the other hand must start ringing for all those who have systems with the 7.4 release, this is because it was announced that no new features will be released and this somewhat foreshadows the announcement of the end of support for that release, although you need not worry, from the date of the announcement you have one year to upgrade to 7.5 or 7.6.
In today’s article, however, we are talking about ACS, the tool that we all use on a daily basis to connect in greenscreen mode to systems. in fact, version 1.1.9.8 has been released which contains new and interesting features:
MFA support: this feature affects 7.6 systems, in fact it allows to use the client to manage MFA of the accounts on which it has been configured
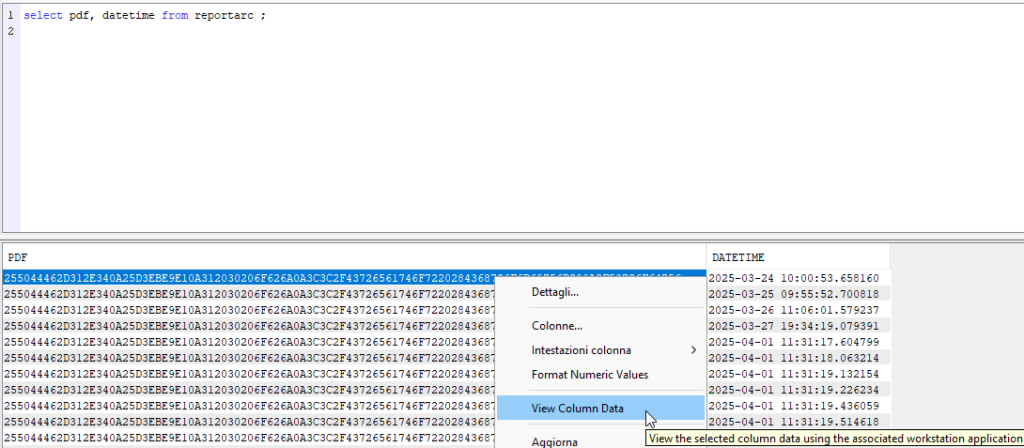
binary object preview: thanks to this new feature it will be possible directly from RUN SQL SCRIPT to preview binary objects saved in our tables like BLOB, BINARY and VARBINARY without using external products. To do this just launch the query that includes the field of interest and right click on the field and select VIEW COLUMN DATA
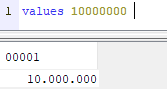
formatting numeric values: how convenient is it to have numeric separators available especially when we are working with numbers with very large values? Here, with the new version of ACS it will be possible to go and insert separators of on the numeric columns in such a way as to simplify their reading
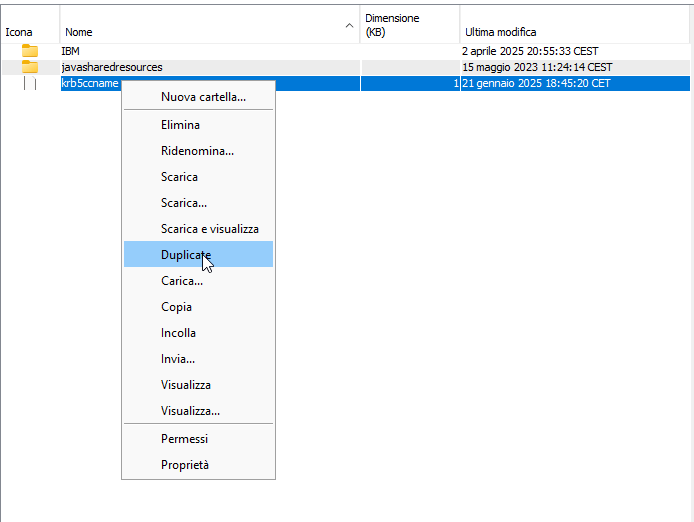
new IFS duplicate feature: from IFS the ability to duplicate IFS files has been added, to do this, right click on the object to duplicate and choose DUPLICATE. This is one of the features that I will use most IFS manager of the ACS. Another feature that I really like is the one related to the transfer of objects from one partition to another, it is very convenient, especially when you have files to transfer to several partitions
Updating the client is very simple, either you download it from the IBM site, or you install a PTF (depends on the release, you can find the documentation at the bottom of the article) and set ACS to search for the new version directly from that system, this is very convenient when you have several client installations on users’ PCs.
In the many realms of IBM i, whether you are a systems engineer, programmer or just an end user, one of the core mechanisms of the operating system is related to the scheduler and its operation. The system scheduler (WRKJOBSCDE) is a very (perhaps too) basic tool, allowing little customization, so it is not uncommon to see custom schedulers created ad hoc in customer systems. A very viable alternative, however, is the Advanced Job Scheduler product, which is distributed in the operating system installation CDs and has code 5770JS1. Lo and behold, until a few years ago the product was available by license, but since last year the tune has changed, i.e., the product no longer requires any license, just install a PTF (link to IBM doc).
Here, compared to the system scheduler, this product has many, many features and customizations that makes it perfectly adaptable to customers’ needs. Here are some features that I particularly like:
group management: with AJS you can go and define chains of scheduled jobs without needing to do it all through CL programs. In this way you can give your jobs a proper dependency order by also setting auxiliary jobs to be submitted in case of errors in the chain
scheduling customization: with AJS you can go and define special rules related to schedules, for example you can go and run the same job several times a day, rather than submitting it at certain times of the day following scheduling calendars, all without putting in lots of different jobs doing the same thing. With AJS it is also possible to condition the submission of jobs on the presence of for example dtaara or the fact that other jobs not in my chain are not active
default parameter management: how convenient to be able to run jobs related to an application or some system function (e.g., backup) with the exact same parameters, such as job queue or user. Here, with AJS you can go and define default parameters for your applications, so that they all run with the same parameters
monitoring: with AJS you can go define a specific message queue in which to send all information related to submitted jobs and their outcome, in which case monitoring that queue will allow you to be able to have information related to the status of the jobs. In addition, it is possible through AJS to set up sending MAIL notifications upon job completion so that you know in real time what has happened
management via Navigator: for about a year, for versions 7.4 and 7.5 with HTTP groups, a lot of AJS functions have been added that can be managed directly via Navigator For I, and yes, it’s really cool because in addition to simplifying the management of the scheduler, it allows you to unlock a lot of features and customizations that are not available via greenscreen, so yes, take a look at it, it’s very interesting
High avalability: it is possible to have multiple AJS instances active at the same time on the systems, this allows for example to have an instance that resides on SYSBAS and an instance that resides on iASP in such a way as to have the information of the jobs that also run on the other systems that share the same iASP
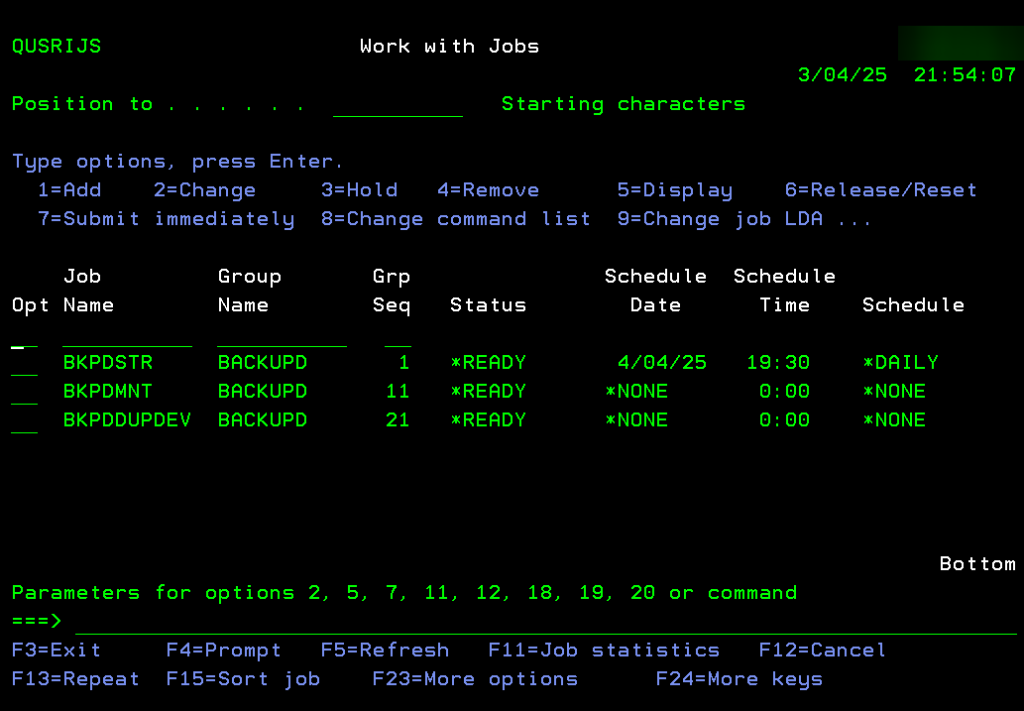
In this example I will show you how I configured all the backup jobs on my system, including the actual backup submission, maintenance brms and duplication on physical tape:
All backups jobs run with the same parameters, here a detail of the application configuration:
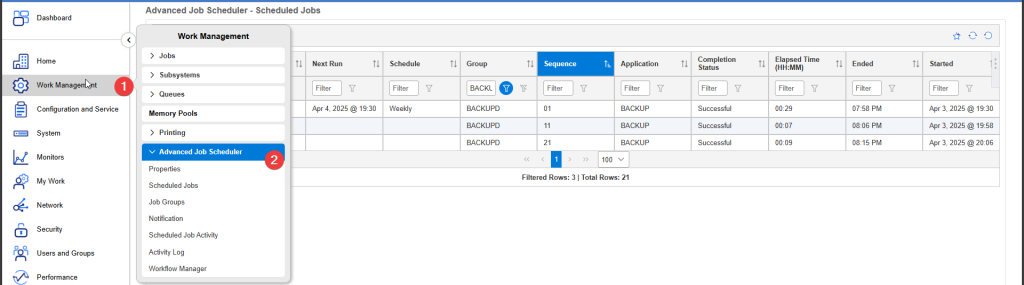
Here the same list from Navigator:
Another interesting feature of this tool is that you can choose to run scheduled jobs on other partitions, for instance on your prodution environment you can choose to sumbit job to other partitions:
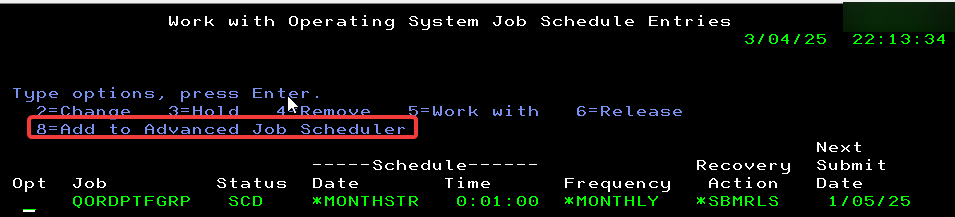
From JS menu options 5 (System controls) and options 7 (Work with Operating System job schedule entries) you can also import WRKJOBSCDE jobs into AJS:
So, here is a short review of this amazing product, and you, do you use AJS or have you ever tried it?
Last week, I had the opportunity to deploy a new partition with Ubuntu on Power installed. This was not the first time I was venturing into such a situation; I had previously deployed some Linux machines, but they were not production machines. This time however is different, a real production partition, internal for my team but still production.
I think some of you are wondering why Ubuntu, well actually the choice was quite simple as I already use it regularly on different architecture, in fact I have the possibility to use it in the x86 world for some tools and services. So building on these skills, I decided to venture out with the installation of a new instance of my favourite architecture, the Power world.
My setup…
My setup involves installing an Ubuntu 24.04 partition on an S1022 server. The disks were presented via fibre channel using one V7300 Storwize.
What I like…
The installation process is the classic one for all versions of Ubuntu and starts automatically once the image is loaded on the Vios and the optic is selected as the device for booting the system. The OS natively supports the network cards that are presented to it, but most importantly, it has native support for MultiPath; no configuration on my part was necessary to define it. This I must say, is a nice plus.
The only thing that needs to be taken into consideration is the need to update the /etc/fstab file when disks are changed, for example in storage migration cases or following a clone of such a disk.
Another very interesting point from my point of view is related to performance, the system turns out to be very performant by taking advantage of all the 8 threads made available by the processor.
What I’m still not sure about…
Here, my experience can be considered satisfactory, I am aware that Ubuntu is a free operating system, which can be installed on our Power servers without any problems but which clearly do not enable us in any way to open a call to the various vendors. One point on which I am noticing improvements is undoubtedly related to the packages available in the various APT repositories. What I am noticing is a continuous improvement in the amount of packages made available, which means that there is a growing interest from developers on the platform, which for me is only a positive aspect. As I said, the number is continuously growing, however the number is perhaps still too low compared to the “little brother” of the x86 version. Unfortunately, there are still too many packages missing that are certainly useful at best and at worst are actually required to run certain software. Once this point is fixed, the diffusion can certainly be improved.
Another point, perhaps the most serious from my point of view, is related to the lack of support for the RMC connection. The RMC connection is the connection established between the HMC console and the single partition and is preparatory to activities of modifying the resources of the partition (such as CPU and RAM), rather than for adding new adapters to the partition, and finally it is essential for the Live Partition Mobility mechanism. Here, without this type of connection it is not possible to perform this type of activity with the machine turned on and this is a problem, because in a scenario in which you want to have the systems always available, having to turn off the system to add RAM is very limiting. I found some packages from IBM, but they are very (maybe too) old, so they are not compatible with new versions due to missing dependencies.
And you, what do you think about adopting Power systems with Linux OS for production workloads?
Many, many times I read in reports from customers or in conversations made in the thousand calls on Teams still misunderstandings about the use of certificates on IBM i systems.
Let’s try today to provide clarity once and for all.
Speaking of certificates in the field of information security, we must distinguish different types of certificates. The first type is certificates with private keys; generally these certificates are used in authentication both from the server’s point of view but also for the client (as in the case of SSH keys). In fact, they are enablers for the use of secure protocols, such as FTPS, HTTPS, TELNETS, etc.
Using secure services, however, it is critical to be sure you are talking to the right peer, otherwise one of the building blocks of cybersecurity. Hence, the need arises to define specific entities that are responsible for signing certificates, whether they are clients or servers. These entities are called Certificate Authorities. However, we can say that CAs are themselves also certificate that enable systems to communicate securely with other systems by asserting ownership of their child certificates.
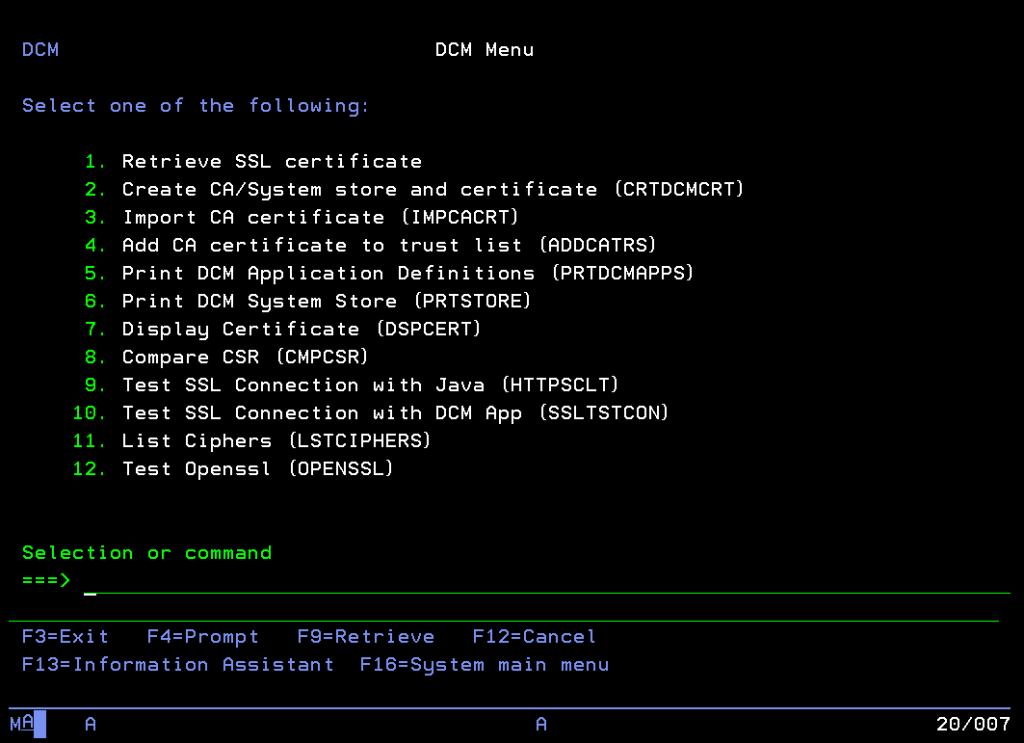
Each operating system has its own certificate repository, my Mac for example has the key fob, IBM i systems also have their own, the DCM (digital certificate manager).
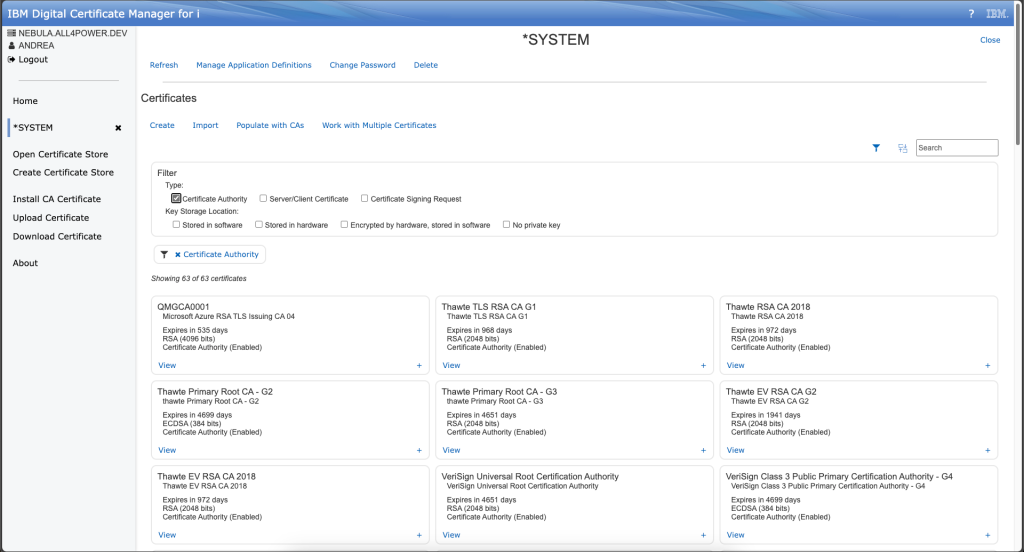
The DCM’s gui is available at http://yourip:2006/dcm. By default, every certificate is stored in *SYSTEM archive but you can also define a custom one.
As you can see, even the DCM treat CA and client/server certificate in different way because of their different nature. From this portal you are able to import/export certificate using easy download and upload feature. In this way you are able to use a temporary path for uploading certificate directly from your browser without transferring it to your system before. In addition, you can also use DCM to create a certificate sign request (CSR), in this case the form asks you to set some values such as name, ip and not forget to put subject alternative name, it’s quite important for HTTPS services, and honestly I don’t know why they do not put it as mandatory.
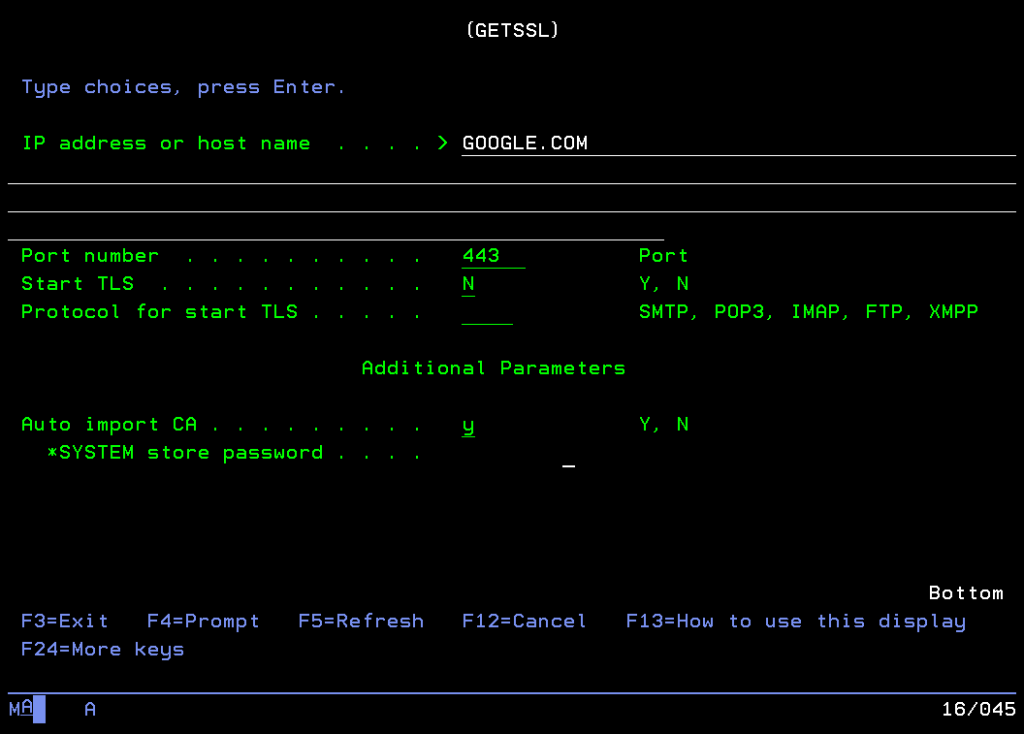
Sometimes could be very helpful import easily some AC… maybe you need to use HTTP functions in QSYS2 and you need to validate server CA. With QMGTOOLS is quite easy. From MENU use option 7 (EBIZ) and after that option 1 DCM/SSL.
Here you have a rich list of feature, for instance you can retrieve or import a certificate, you can check a certificate or you can test some application using OPENSSL. In our case we will try to retrieve and import a certificate into our CA store.
In our case, we are trying to import the CA that has issued certificate for google.com (service listening on 443 port). Consider that it works only if all certificate path before this CA is already trusted, in some cases on DCM you can find a useful list of CA that you could enable. This list is automatically updated with ptfs.
And you, have you ever used DCM or GETSSL command in your environment?