
Syslog, short for System Logging Protocol, is one of the cornerstones of modern IT infrastructures. Born in the early days of Unix systems, it has evolved into a standardized mechanism that enables devices and applications to send event and diagnostic messages to a central logging server. Its simplicity, flexibility, and widespread support make it indispensable across networks of any scale.
At its core, Syslog functions as a communication bridge between systems and administrators. It allows servers (also IBM i partitions), routers, switches, and even software applications to report what’s happening inside them—be it routine processes, configuration changes, warning alerts, or system failures. It is also possible that these messages are transmitted in real time to centralized collectors, allowing professionals to stay informed about what’s occurring in their environments without needing to inspect each machine individually.
This centralized approach is critical in environments that demand security and reliability. From banks to hospitals to government networks, organizations rely on Syslog not just for operational awareness but also for auditing and compliance. Log files generated by Syslog can help trace user activities and identify suspicious behavior or cyberattacks. That makes it an essential component in both reactive troubleshooting and proactive monitoring strategies.
So, in IBM i there al least three places in which you are able to generate Syslog.
The first place where you can extract syslog format is the system log. The QSYS2.HISTORY_LOG_INFO function allows you to extract output in this format. In my example, I want to highlight five restore operations performed today: SELECT syslog_facility, syslog_severity, syslog_event FROM TABLE (QSYS2.HISTORY_LOG_INFO(START_TIME => CURRENT DATE, GENERATE_SYSLOG =>'RFC3164' ) ) AS X where message_id='CPC3703' fetch first 5 rows only;
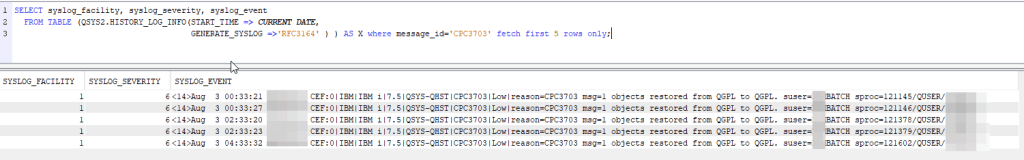
By changing the condition set in the where clause it is possible to work on other msgids that could be more significant, for example it is possible to log the specific msgid for abnormal job terminations (since auditors enjoy asking for extraction on error batches).
The second tool that could be very useful is the analysis of journals with syslog, in fact the QSYS2.DISPLAY_JOURNAL function also allows you to generate output in syslog format. In my example, I extracted all audit journal entries (QSYS/QAUDJRN) that indicated the deletion operation of an object on the system (DO entry type): SELECT syslog_facility, syslog_severity, syslog_event FROM TABLE (QSYS2.DISPLAY_JOURNAL('QSYS', 'QAUDJRN',GENERATE_SYSLOG =>'RFC5424') ) AS X WHERE syslog_event IS NOT NULL and JOURNAL_ENTRY_TYPE='DO';
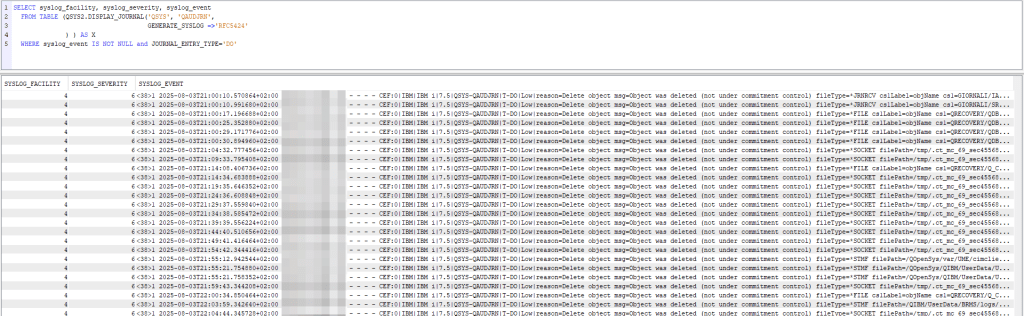
Of course, it is possible to extract entries for any type of journal, including application journals.
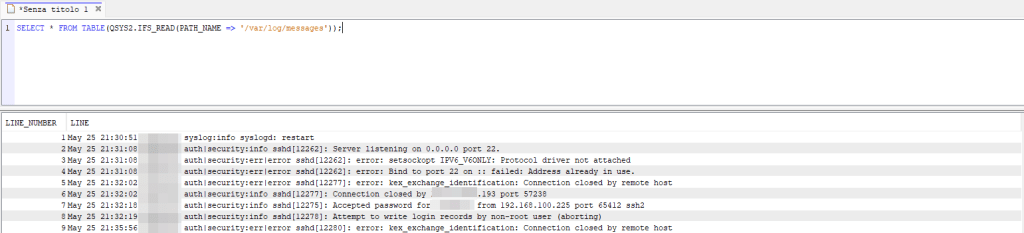
The last place that comes to mind is the system’s syslog service log file. In a previous article, we saw how this service could be used to log SSH activity. In my case the log file is located under /var/log/messages, so with the QSYS2.IFS_READ function I can read it easily: SELECT * FROM TABLE(QSYS2.IFS_READ(PATH_NAME => '/var/log/messages'));
These are just starting points… as mentioned previously, these entries are very important for monitoring events that occur on systems. Having them logged and stored in a single repository for other platforms can make a difference in managing attacks or system incidents in general.
Do you use these features to monitor and manage events on your systems?
Andrea
Trackbacks/Pingbacks